
Scripted Analysis for Reproducibility
Reproducible research is a broad topic that includes addressing bias, statistical optimism, experimental design, and much more. In this article, we’re limiting ourselves to one topic that can help advance the reproducibility of your science: scripted analysis.
Research Without a Reproducible Paradigm
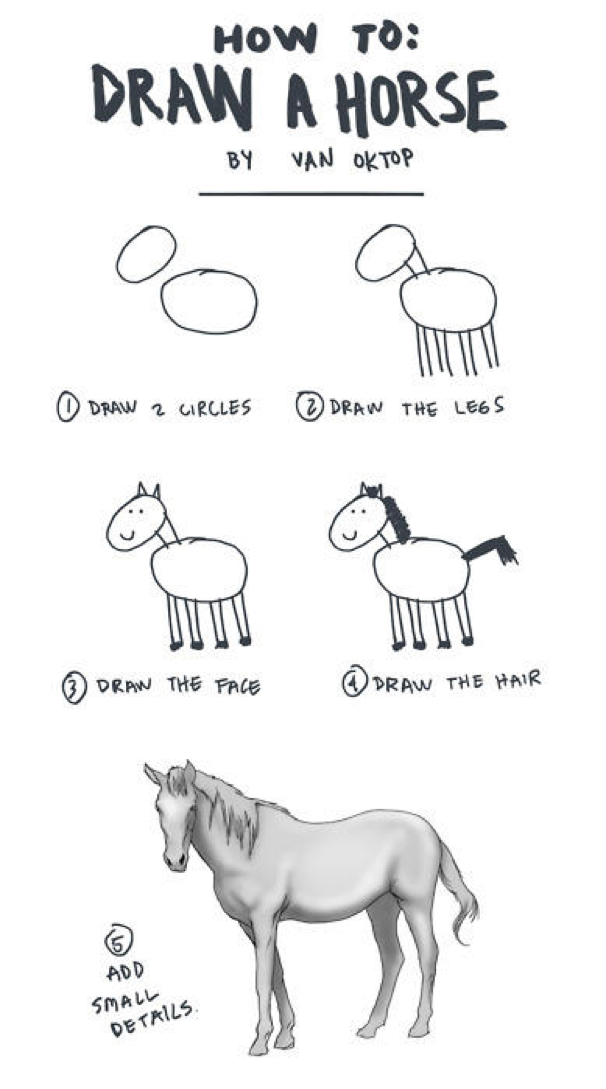
If you’ve ever tried to replicate an analysis or study procedure from just the methods section of a paper, you probably experienced it as something like this (used with artist’s permission):
In fact, if you’ve got several projects going on at once, it might feel like you’ve even done that to yourself from time to time. If you’ve ever been stymied by your own cryptic notes or those of an RA or collaborator about “what to do to the Excel file”, or felt dread at trying to reproduce your own findings a few months after doing it the first time, you understand the need for analysis that’s easy to re-execute, without having to guess or spend inordinate amount of time trying to figure out how the heck one step led to the next.
Whether you’re interested in other scientists being able to easily reproduce your experiment or analysis or not, you’re certainly invested in making your own research go more smoothly and advance more quickly. If you experience any of the following, or similar symptoms of non-reproducible research, this article is for you!
- You send emails to RA’s who left your lab 2 years ago to help you understand datasets
- You dread having to redo your analysis after having set a project aside for a couple of months
- You realize that 4 subjects were seen after you pulled the “final” data set but opt to not include them because it would mean tens of hours of work and you’re on deadline
- You rely unduly on certain people / certain computers (if Jane is on vacation, I can’t get ___)
Advantages of Scripted Analysis
Research that is created in a reproducible paradigm permits that:
- You can reproduce your own steps easily (when more data comes in or you have to correct something 3 steps into a 25 step process)
- Others can reproduce your methods on their own data easily
- (Maybe) others can reproduce your methods on your data easily
- You can collaborate more easily with on- and off-site collaborators
- You can track changes to your data, your analysis, your conclusions, and easily pinpoint what you changed when, and why
- You can integrate reviews, stips, audits with less pain
- Your research is robust to technology changes
By using a script, you simply execute the code that could have multiple steps, such as combining data, de-identifying and cleaning data, performing analysis and statistical tests, and creating visualizations. If more data get added, you simply run the script again. You already did the hard work of writing the script, so now all you have to do is essentially hit “run”.
If you realize that your workflow needs a bit of tweaking toward the beginning, you can update that part of your script and leave the rest untouched. Again, you just run the script with your changes, and you’ve saved yourself a lot of time compared to when changing something far upstream of your analysis meant hours of manual cleaning of data or re-creation of new files.
Scripted analysis and other technological tools (such as version control and containerization) will improve the longevity of your science and allow you to reuse your work much more easily. While there is a learning curve associated with developing skills in these tools, the end result of learning scripted analysis means that you’ll save time in the long run, especially if you have workflows that repeat across projects.
It’s worth considering the words of an archaeological team that recently wrote an article about reproducible research for a lay audience in Slate:
However, while many researchers do this work by pointing and clicking using off-the-shelf software, we tried as much as possible to write scripts in the R programming language.
Pointing and clicking generally leaves no traces of important decisions made during data analysis. Mouse-driven analyses leave the researcher with a final result, but none of the steps to get that result is saved. This makes it difficult to retrace the steps of an analysis, and check the assumptions made by the researcher.
…
It’s easy to understand why many researchers prefer point-and-click over writing scripts for their data analysis. Often that’s what they were taught as students. It’s hard work and time-consuming to learn new analysis tools among the pressures of teaching, applying for grants, doing fieldwork and writing publications. Despite these challenges, there is an accelerating shift away from point-and-click toward scripted analyses in many areas of science.
Okay, I’m Convinced!
If you’ve decided that you’re ready to move from a point-and-click research method (using Excel or a commercial statistical product like SPSS) to a script-based methodology, where do you start?
For beginners to the coding world, I suggest R and RStudio, which together allow you to learn to code in a relatively intuitive and helpful way. There are four places I send people first:
- DataCamp’s Intro to R allows you to try out R (but not the helpful extra scaffolding of RStudio) for free, without downloading anything. Very low stakes chance to try it out. The course is very small in scope but I find that it helps cut through the stress of trying out something new, since it’s so easy to work with.
- A similar course by O’Reilly has a broader set of topics and is a little less class-like and more tutorial. If you thought that DataCamp was a bit too cutesy and want something you don’t have to create an account for, this might be the choice for you.
- Swirl allows you to start using R right away in an interactive learning environment. It can be a little silly (especially the cheerful encouragement messages), but it allows you to actually start using R right away. You’ll need to install R and RStudio to work with Swirl. Once you’ve done the intro to R piece, you can then move on to other courses that are structured in the same easy, step-by-step tutorial way, including courses on inferential stats, data visualization, cleaning data, etc.
- Johns Hopkins has a great R Programming course that forms part of their Data Science Specialization. For people who are more project-based, and want to spend a bit more time, or who respond well to course-based instruction, this is my preferred path.
Once you get your mind around R a little bit, you will likely want to expand into other tools that will help with your workflow: things like version control with git, literate statistical programming, and possibly containerization (if you’re sharing with collaborators and/or use very specific package versions).