
What Type of Machine Learning Should I Use?
When you read the phrase “machine learning,” what’s the first thing that pops in your head?
Maybe you’ve read about neural networks, and their use in black-box algorithms. Or perhaps you’re curious about random forest classifiers or supervised and unsupervised learning. You may have colleagues that are encouraging you to try out a specific method, or you may be venturing on your own into a new skill-set (welcome!).
For many of us, our journey with machine learning starts with a mixture of impressions like these. Machine learning is one of the most widely-hyped skill-sets coming into 2020 - and, depending on your frame of reference, may also be one of the more widely criticized approaches to data.
Let’s demystify machine learning! In this article, you will learn the fundamentals of machine learning from a researcher perspective. At the end, you will be able to frame a research question as a machine learning task and identify the appropriate family of algorithms.
What is machine learning?
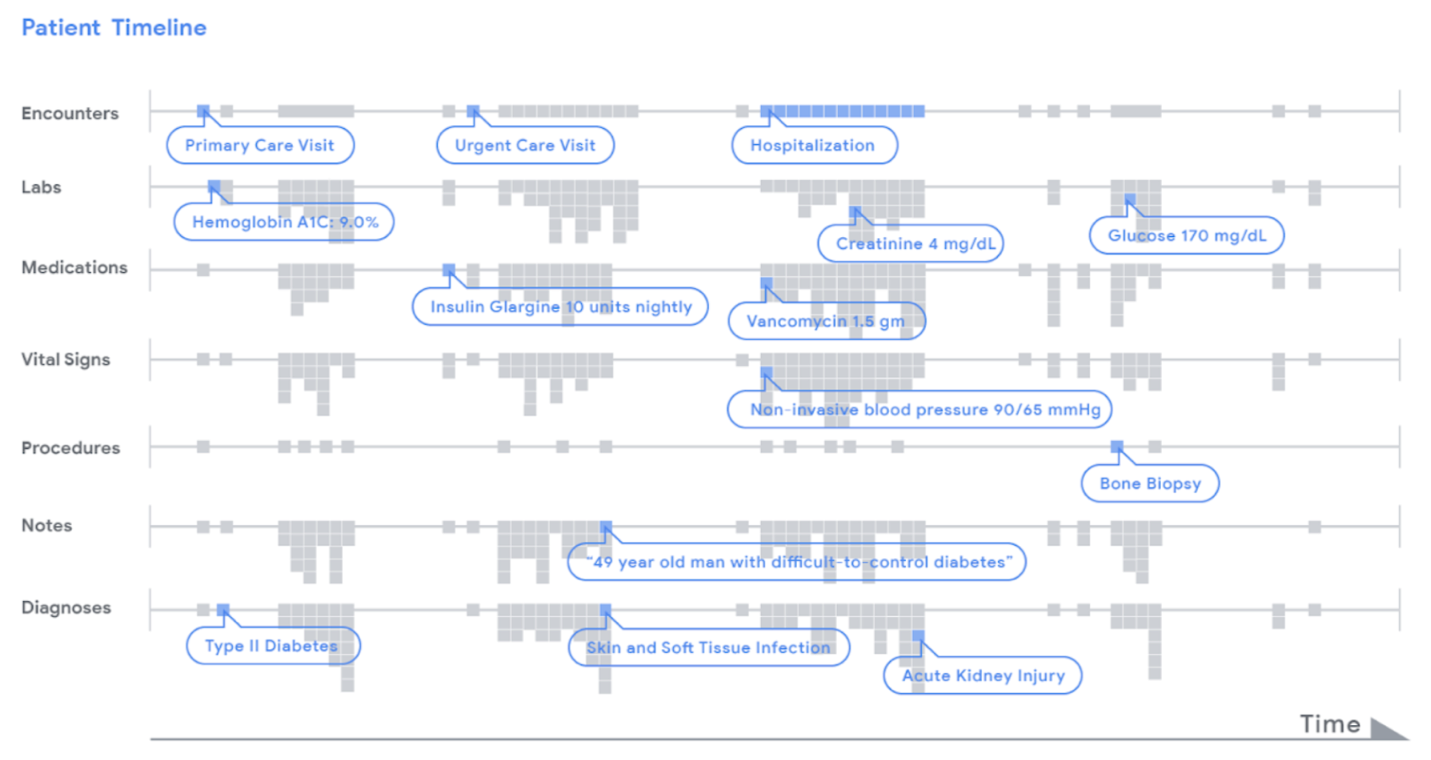 Figure 1: Electronic Health Record data provide complex opportunities for machine learning (Rajkomar and Oren, 2018).
Machine learning is the use of algorithms to identify patterns in data that help perform a task better. You improve the algorithm by exposing it directly to data – in this sense, the algorithm “learns” from data. We call this training a machine learning algorithm.
You can think of machine learning as a subset of artificial intelligence: the endeavor to develop computational systems that take actions towards a meaningful goal within an environment.
Let’s take a look at each of these three components: the machine learning task, the data, and the training process.
Machine learning is task-oriented
The goal of machine learning is to create a model that can perform a task well. Common tasks include:
- Predicting a label or category
- Predicting a quantity
- Assigning a group membership (or “clustering”)
- Reducing dimensionality or complexity
- Learning to act in a system
In medical research, the classic prediction task is diagnosis: does the patient have X disease or not, given medical imaging results?
 Figure 2: What type of retinal disease? A task to assign retina images one of four labels (Kermany et. al, 2018)
If you work with -omics data, you may work with special applications of clustering in differential gene expression analysis: can we use RNA-seq data to identify clusters of closely related genes based on their patterns of expression?
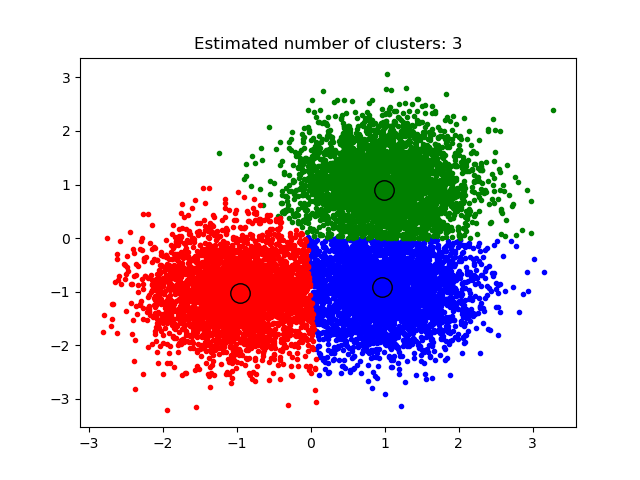 Figure 3: Each observational unit is assigned one of three clusters (Comaniciu and Meer, 2002).
As researchers, we may be interested in both the literal outcome of the task (what’s the diagnosis? what’s the group?) and the patterns that make the task possible. That is, we may actually care more about what variables our algorithms found useful to make the decision - what clues were helpful for a successful diagnosis, for example. No matter our strategy for interpretation, machine learning takes a definitively task-centered approach to understanding data.
Every machine learning task relies on useful data
In the medical research domain, useful data might look like:
- Clinical notes from the bedside (unstructured text data)
- Lab results (numeric and time data)
- MRI and fine-needle aspiration data (imaging data)
- Audiograms (signal data)
- Electronic health record data (heterogeneous and big data)
In machine learning, we call all variables we consider for our task features. Our feature set can include anywhere from a few to millions of variables that may be of interest, but usually exclude variables that do not contain relevant information, such as row IDs.
While the machine learning training process is receptive to many different types of features, note that the process of preparing, distilling, crafting, and selecting features from data sources is one of the most complex and meaningful aspects of machine learning. Feature engineering is the term for preparing useful features for a training process. Note that we tend to consider processes like “data cleaning” to be prep-work before we get to our analysis - but this is often the very heart of our research endeavor! The decisions we make on how to model reality in variables is absolutely essential to our ability to derive meaningful conclusions.
Note that there are two fundamental kinds of data you may use in machine learning: labeled data and unlabeled data. Labeled data refers to feature sets that come paired with some kind of target outcome:
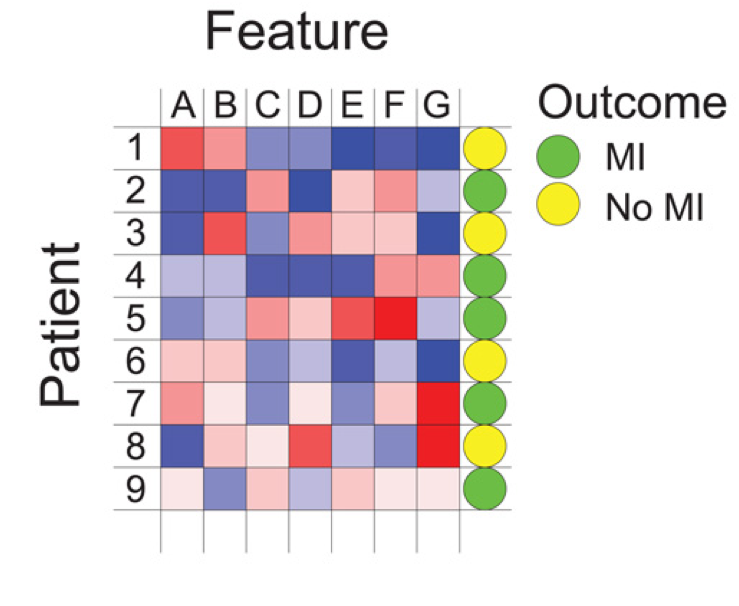 Figure 4: Patient data showing a feature set (variables A to G) alongside a categorical target outcome (Deo, 2015).
When training a model to diagnose pathology, we may use a labeled dataset with a categorical variable called “diagnosis” with values such as “benign” or “malignant”.
In contrast, unlabeled data lacks an a priori target in the data. We have to infer an output ourselves, such as assigning a group or cluster membership to observational units. The presence or absence of a target outcome vastly changes our approach to algorithm selection, as you will see shortly.
Machine learning algorithms learn to perform their task via training on data
As we’ve discussed, machine learning is a process of finding a pattern in data that helps perform a task. Our assumption is that some pattern lurks in our feature set that - if we could only find it! - would help perform the task with some reliability.
Let’s say we have admissions data for a university. Our feature set includes scores on two exams, which we could plot on an x and y axis (exam 1 and exam 2, respectively). We also know whether students have been admitted or not, which we can represent in the marking style of the points in our scatter plot:
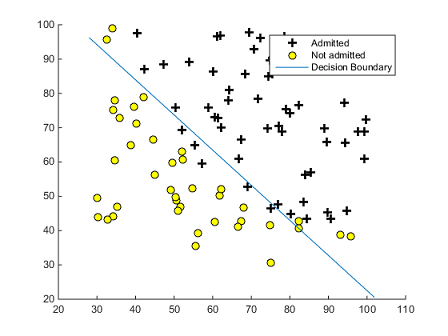 Figure 5: Learning a decision boundary for student admission, as plotted on test results (qqdaiyu55.github.io)
How can we reliably predict if a student will be admitted or not, given their exam results for exam 1 and 2? One way to approach this problem is to determine a decision boundary. This decision boundary gives us a robust way of predicting whether a student will be admitted. We can plot their test results on the grid. If they fall under the slope, we predict the outcome “not admitted”. If they fall over the slope, we predict the outcome “admitted.”
So how do we determine the decision boundary? The goal of machine learning is to learn some function - a linear boundary, or something far more complex! - that can take in inputs and perform a task robustly. In other words, we want to generalize based on a pattern we’ve seen to performing our task well in new circumstances.
To accomplish this generalization, we must train our machine learning model. Here is an overview of the steps involved:
A VERY BRIEF Overview of Training a Machine Learning Model
-
We usually begin with a set of observations in front of us called training data. We suspect a latent pattern may exist between variables in data, but we usually don’t know what the pattern looks like ahead of time.
-
Machine learning algorithms “learn” a relationship between our feature set and some outcome (such as a class, a quantity, a grouping, etc.) This learning is incorporated into the algorithm through parameters like rules, weights, and other design elements.
-
Learning does not happen instantaneously. Our model instead goes through a cycle: we expose it to data, the model changes in some fashion, we evaluate the impact of those changes on more data, the model changes to better incorporate this new data, and so on.
-
We also usually experiment with different settings of our model. The term hyperparameters refers to the parameters that guide the training process. Common parameters include how many clusters to seek out, how to introduce randomness into the training process, etc. We may use associated metrics to judge the performance of our hyperparameters.
-
Once we’ve found an appropriate model and settled on appropriate hyperparameters, we usually set it loose on previously unseen data. We then look at metrics that gives us clues to how well our model performs in this new situation.
We will return to the pragmatics of the training process at the end of this article (and in future articles). For now, keep in mind that we must constantly consider the tradeoff between “how successful is this model at performing the task with data we’ve already gathered” and “how successful will this model be at generalizing to a new context with data we’ve never seen before?” This tension in generalizing effectively is a key concern of machine learning.
Is machine learning different from statistics?
Yes and no. Machine learning is heavily related to, but distinct from traditional statistical methods. Statistical inquiry is usually model-first and emphasizes inferential reasoning. In contrast, ML is generally data-first and is focused on performing a task
However, sound statistical reasoning is imperative for conducting good science, regardless of the algorithm or task you choose! Is a sample of individuals representative of the population as a whole? If it isn’t, how do you measure skew and bias? How does your machine learning methodology account for missingness or correlated variables? These are questions that statistical reasoning can help you to answer.
How do I go from a research question to machine learning algorithm?
This article is focused on the “what type of machine learning do I use?” question. But in reality, this is only a question you should ask after you’ve examined your research question closely.
Let’s take a look at one research question we can frame as a machine learning task:
Case study: Sepsis events in the NICU
Sepsis is a potentially devastating event in a neonatal intensive care unit (NICU) setting. If clinicians could predict the onset of sepsis more reliably, they could reduce inpatient mortality for the most vulnerable patients. A team of researchers collects data on thousands of cases of infants, with a mix of septic and non-septic events in the NICU. Is it possible for the team to use data from previous cases to improve prediction of sepsis events? If so, which of 30 possible indicators should clinicians prioritize at the bedside?
This example is based on recent cutting-edge research into NICU sepsis. Making accurate predictions at the bedside is a complex challenge! How can we leverage machine learning to help?
Let’s break this research question down into two components: machine learning task and relevant research data.
Identify your task: predict a label
Our goal is to “predict the onset of sepsis.” That is, our task is to make a prediction. Specifically, we would like to predict whether a patient will become septic or will not become septic. We can phrase this as a categorical prediction or label prediction task.
Note that how we frame this task is extremely important. For instance, how do we extract the label of “sepsis” from our clinical data? What precisely are we trying to predict? In the 2019 NICU sepsis study, the prediction task is not framed around the onset of sepsis, but four hours before the clinical observation of sepsis. The researchers note that risk of mortality increases rapidly over the course of sepsis. This is a vivid example of the importance of defining a machine learning task that is impactful for the domain of application.
Evaluate your training data: labeled data
If we wish to train an algorithm to make a prediction well, we need to supply it with relevant features that may supply a pattern we can use in prediction. (Remember that we refer to input variables we consider in machine learning as our feature set). To train our classifier to predict an outcome, we need to use training data that specifically includes the target output (in this case, the variable is_septic) alongside the feature variables. This prepares our algorithm for future situations, where it only looks at the input feature set and must make a determination of the appropriate prediction of is_septic.
Our feature set often represents the end-point of a process to gather and harmonize variables. In the NICU sepsis example, the research team considered thirty variables that are a mix of lab results, clinical observations, etc. Note that our outcome or target variable is also the result of such a process - it’s doubtful that “four hours before clinical observation of sepsis” is a variable that exists ready-made in an electronic health record!
As we gather and prepare our data, it’s helpful to have a rough sense of the scope of our dataset. In this case, we’re working with somewhere between hundreds and thousands of children (n=500-2,000) and a feature set that includes ~30 possible variables. We can estimate the dimensions of our feature set as 30 x 1000, and the dimensions of our target output as 1 x 1000.
Select an appropriate algorithm family: supervised learning
What is supervised learning?
The task of prediction belongs to a larger set of machine learning tasks called supervised learning.
Supervised learning refers to the task of mapping an input variables to an output variable based on training data. The key to supervised learning is that it relies on labeled training data where we have access to both the feature set and the output variable for the learning process.
Supervised learning comes in two main flavors: classification and regression.
Classification is supervised learning where our output or target variable is categorical/nominal. Predicting a class such as septic/not septic, benign/malignant, or low risk/medium risk/high risk are all examples of classification tasks.
Regression is supervised learning where our output or target variable is a continuous quantity. Predicting an output like “days in the NICU”, “tumor mass thickness”, or “days in the NICU” are all examples of regression tasks.
In this case, our interest is to predict the class of septic/not septic, so we will select supervised classifier algorithms as our family of machine learning algorithms.
How is supervised learning different from unsupervised learning?
Imagine that you have a dataset describing a number of clinical characteristics of patients in the NICU, but you don’t know whether the patients had a sepsis event or not. This data still includes a feature set of relevant information about each patient. However, it lacks a target output variable.
In this case, you are able to conduct unsupervised learning. Unsupervised learning draws inferences from unlabeled data without knowing a target or outcome variable. As a result, the type of insights you gather are usually more exploratory, such as identifying clusters of patients that show common groupings of indicators. These algorithms function differently than supervised algorithms, as they strive to find patterns or commonalities without optimizing for a specific target or outcome.
Two common types of unsupervised learning tasks are clustering and dimensionality reduction
Clustering algorithms assign all observational units in a dataset to one of k clusters. K may vary anywhere from two to hundreds or more, but in most use cases is somewhere in the 2-20 range. One way to phrase the goal of clustering is the following:
The goal of clustering is to reveal subgroups within heterogeneous data such that each individual cluster has greater homogeneity than the whole (Eick et al., 2004).
*Dimensionality reduction is a family of unsupervised learning tasks that confront the challenge of working with data with many candidate features, or variables, for consideration. We may use dimensionality reduction to select only features that provide high amounts of information, and to exclude possible features that are heavily correlated with our data or otherwise uninformative. You can think of dimensionality reduction as the clustering of variables themselves in order to derive a more useful feature set
What other possibilities exist?
There are other categories of machine learning tasks that may be relevant to you, however! One important method is reinforcement learning. Also, there are hybrid approaches such as semi-supervised learning. However, they are beyond the scope of this introduction.
Identify an appropriate machine learning model
Once you’ve clarified your machine learning task, you’re ready to start considering the specifics of training a machine learning model, which includes selecting an appropriate model for your task. Remember that the machine learning model is the algorithm that changes and improves as it comes into contact with training data, and retains that improved insight within parameters like weights, rules, decision boundaries, etc.
What options exist?
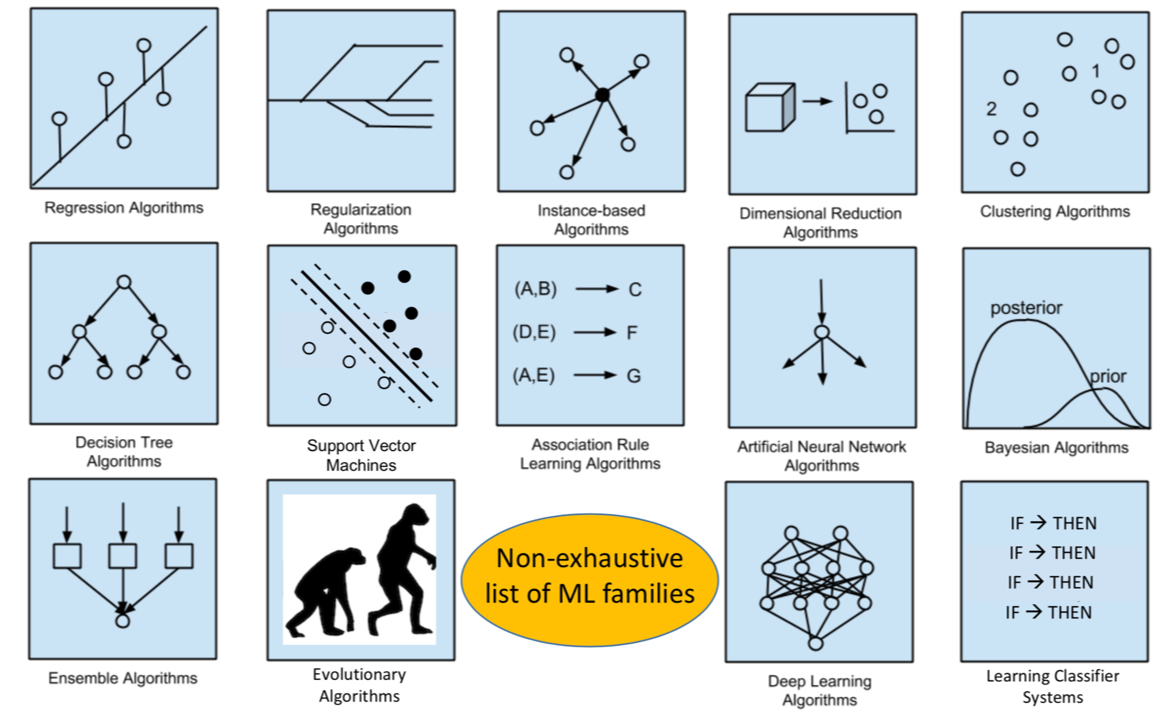 Figure 6: A wide variety of machine learning models exist. We’ll break this down (Urbanowicz, 2019).
Note that there is no single, optimal algorithm to use for machine learning. The “no free lunch” (NFL) theorem states that no model can be optimal for all tasks and all data. Instead, we can allow the category of learning (supervised and unsupervised) and specific task to narrow down possible models (as not all models can handle the absence of training data or categorical vs numerical data, for instance.) Within each category, we can begin with tried-and-true approaches, but maintain an open perspective and compare performance. Let’s get started.
For now, let’s quickly introduce some of the possibilities:
Algorithms for classification (supervised learning), in rough order of complexity
- k-Nearest Neighbors (k-NN)
- Logistic regression (sometimes considered ML and sometimes not)
- Naive Bayes
- Decision trees and random forest classifiers
- Support vector machines (including kernel trick methods)
- Neural networks (including convolutional neural networks)
- Ensemble classifiers
Algorithms for regression (supervised learning)
- Linear regression (like logistic regression, sometimes contested as an ML method)
- Single gradient descent regression
- Lasso regression/ridge regression
- Gradient boosting trees
- Neural networks
Algorithms for clustering (unsupervised learning)
- k-means clustering
- Hierarchical clustering
- Gaussian mixture model
Algorithms for dimensionality reduction (unsupervised learning)
- Randomized Principal Component Analysis (PCA)
- Latent Dirichlet analysis (LDA)
Tradeoffs in model selection
Within each category, what estimator do we expect will perform best? The answer is very much “it depends”, based on factors such as sample sizes, performance of other models, etc.
As algorithms increase in complexity, they tend to decrease in interpretability. For instance, when selecting a classifier, logistic regression is considered one of the most interpretable algorithms, as you can articulate the impact of a change in a given variable as increasing or decreasing the odds of observing the target outcome. Logistic regression performs moderately well in many use cases, but lacks the ability to learn some very complex patterns. In contrast, neural networks are capable of learning very complex patterns, but their inner workings are notoriously difficult to interpret (thus the phrase black box to describe neural networks).
Note that every model within a group performs the same task, but go about that task in different ways. We’ll expand more on the specifics of selecting models and model hyperparameters in future lessons, but for now, it’s important to recognize their role in the machine learning process.
Fortunately, workflows for machine learning in Python and R tend to support quickly substituting models for one another. You can consider model selection and hyperparameter tuning to be two main tools in your toolkit for working towards optimal performance of your machine learning task.
As with most things in life, you do not need to know everything about every model before jumping in! Starting with one model that is appropriate for your machine learning task + data is an excellent starting point. One foot in front of another!
Where do I go from here?
Now that you’re familiar with machine learning concepts and how they relate to research, it’s time to start experimenting with implementation! You may be ready to jump straight into supervised classsification in R or peruse other ML articles here. Alternatively, take a look at upcoming in-person learning opportunities to dig in with a hands-on workshop.
Works Cited
Figures:
- Rajkomar, Alvin and Oren, Eyal. (2018). “Deep Learning for Electronic Health Records”. Google AI Blog. Accessed 2020-01-15 at https://ai.googleblog.com/2018/05/deep-learning-for-electronic-health.html
- Kermany, D. S., Goldbaum, M., Cai, W., Valentim, C. C., Liang, H., Baxter, S. L., … & Dong, J. (2018). Identifying medical diagnoses and treatable diseases by image-based deep learning. Cell, 172(5), 1122-1131.
- Comaniciu, Dorin and Meer, Peter. (2002). “Mean Shift: A robust approach toward feature space analysis”. IEEE Transactions on Pattern Analysis and Machine Intelligence., 603-619.
- Deo, R. C. (2015). Machine learning in medicine. Circulation, 132(20), 1920-1930.
- https://qqdaiyu55.github.io/2016/02/11/plot-classification-decision-boundary/
- Urbanowicz, Ryan. (2019). “ML_Pipeline_Notebooks”. Access on GitHub at https://github.com/UrbsLab/ML_Pipeline_Notebooks/