
Using the REDCap API
We’ve talked before on this site about the usefulness of APIs (Application Programming Interfaces) in data analysis. Let’s apply those benefits to data stored in REDCap!
API Overview
There are two principal benefits to using APIs:
- Data freshness
- Scripted reproducibility
Data Freshness
With API calls, you get your data fresh every time, instead of relying on potentially stale downloads. Reaching into your file system to get a .csv or .json file to analyze can be tricky if you have multiple versions, and it’s easy to do analysis on an obsolete file if you’re not careful. For example, let’s say you have to run some analysis on data you’re collecting in REDCap, and you want to re-run this analysis every couple of weeks to see the latest figures. One way to do that is to manually export data to a .csv and save it to a file that your R or Python script will then open and work with. But REDCap likes to download files with a date stamp as part of the file name, so you have to remember to either change the name of the file to whatever standard file name you want your script to use, or change the file name each time in your script. You may also end up collecting multiple .csvs in various directories, each of which has a particular version of the data in REDCap. This can easily become overwhelming and cause confusion.
What’s a better approach? Reach into the REDCap database directly each time you run your script, so that you know you’re using the most up-to-date data. Read on to learn how to do this!
Scripted Reproducibility
Another problem with using downloaded files from REDCap is that this method requires unscripted, point-and-click manual work. If you were to document this carefully, you’d have to give several steps, like where to log in to REDCap, which project to use, the .csv download settings (which fields or forms to download), file naming conventions, and where to put the file. Most of us don’t go into this level of detail in our manual workflows, for good reason! It’s tiresome, and we know that sometimes things change in the look and feel of a website, so including screenshots and detailed instructions about where to look for a link or how to highlight multiple fields is a lot of work for something that might have slightly different steps next week or next month.
A better approach is to use a script that uses an API call. First of all, it’s scripted, which means no manual steps to write up in a Word document or add to a GitHub repo. Also, the typical API has a standard interface that will rarely, if ever, change. API access may improve over time, adding new features, but it’s very infrequent that an API will radically change and remove options, rendering your script unusable. The same half-dozen lines of code you use to access your data will almost always be stable for months or years, and if you do need to change it, you’re only changing that small chunk of code, instead of a step-by-step document with words and images that guide a manual effort.
API Keys
APIs are automated, which means they won’t rely on you logging in manually, adding a user name and password. API calls have to run without human intervention, which means you need to provide your script with credentials that show you are allowed to log in and see the data you’re accessing. But obviously you don’t want to put your user name and password in a script. Your user name and password open a lot of doors at CHOP, from your email to your payroll information to Epic. You want to isolate just your access to this particular data, and using your all-powerful login information to access REDCap data is far too powerful. What if your credentials fell into the wrong hands, because they were in a script on a drive that many people have access to? This is where API keys or tokens come in. API credentials give very specific access to very specific things, and can be regenerated easily, in case you suspect they may have been lost or misused. If API credentials do fall into the wrong hands, it’s not great, but it’s much better than accidentally sharing your CHOP username and password! Different APIs have different methods for giving you the key to your data or application, and different methods for supplying that credential when your program tries to make contact. In REDCap, the term for that key or credential is “token,” and this article will show you how to generate a token for your data.
In REDCap, the project owners (or people with user rights) have to explicitly give permission to use the REDCap API. In fact, when you create a new REDCap project, REDCap does not provide you with these permissions, even though you’re the project owner. Take a look at your REDCap projects and look on the left hand side of the screen to look at the menu of options. Chances are, you won’t see anything that says “API”. If that’s the case, don’t worry. We’re going to take a project you own (or quickly create a project and put some fake data in it) and walk you through how to give yourself API access.
Giving Yourself Access
Pick a REDCap database that belongs to you or in which you have the ability to change user rights (a very high level of privilege that you may not have on projects you didn’t create). If you don’t have a REDCap database of your own ready to use, or if you prefer to work with a toy example first that’s not connected to your real data, then follow the steps in the next section to create a new project. Otherwise, open up a project in which you have User Rights capabilities, and jump to the section on Enabling the API.
Creating a REDCap Project
If you can’t or don’t want to use your own existing REDCap project, you can clone a sample project from us. We’ve taken data from the University of California, Irvine Machine Learning Repository, specifically, their dataset on cervical cancer risk factors, and made that data into a REDCap project. Here are the steps to take our REDCap project and make it yours!
- Download our REDCap xml file, saving it to a place you’ll be able to find it (like your Downloads folder). We suggest doing a right click on the link and choosing Save Link As, or Download Linked File As.
- Log in to your REDCap server and choose New Project.
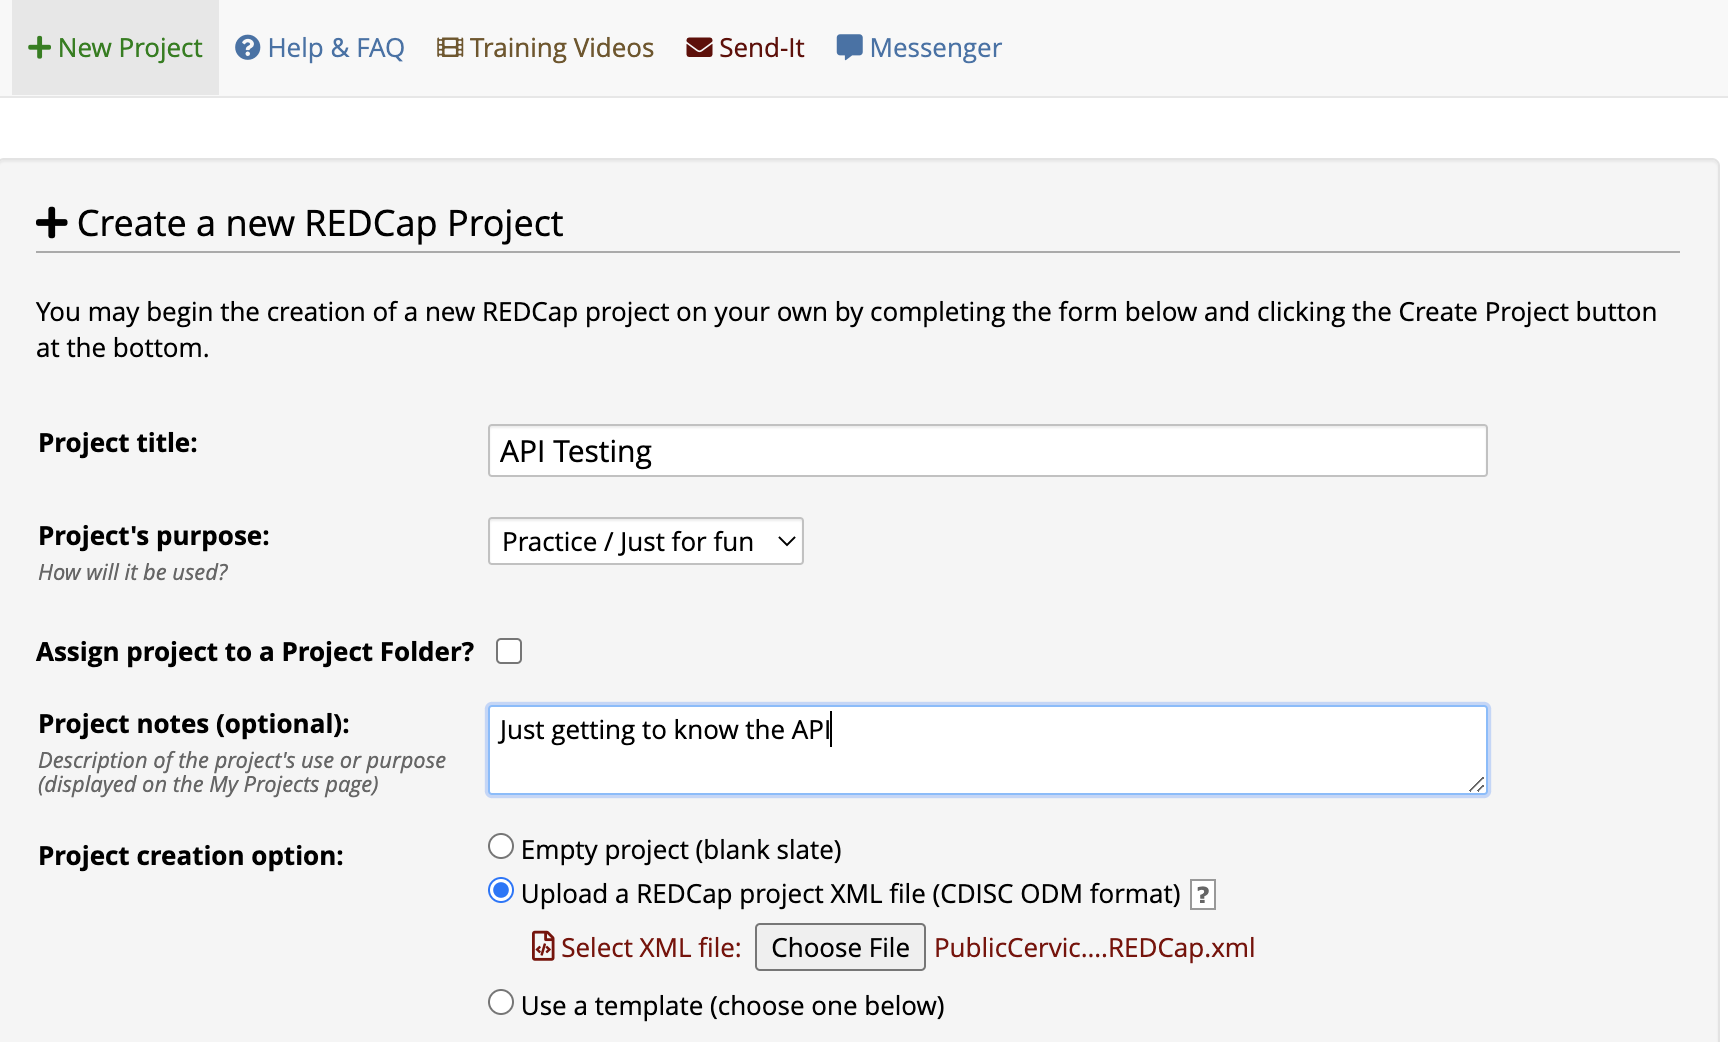
- Fill out the Project title, Project purpose, Assign project to Folder, and Project notes fields as you like. We called our project “API Testing” but that’s only a suggestion.
- Choose Upload a REDCap project XML file as the Project Creation option.
- Click Choose File, and in the file picker, navigate to where you saved our XML file.
An image below shows what you might see after steps 1-5 (note that many institutions personalize their version of REDCap — this is what CHOP’s REDCap looks like, but other institutions may use different colors, layout, etc.).
- At the bottom of the page, click Create Project. It may take a few minutes to digest that giant XML file!
Congratulations, now you have a project that you created, which means you have User Rights capabilities!
Enabling the API
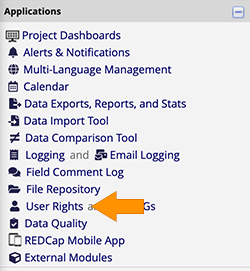
In your REDCap project, on the left side of the screen, choose User Rights from the list of applications.
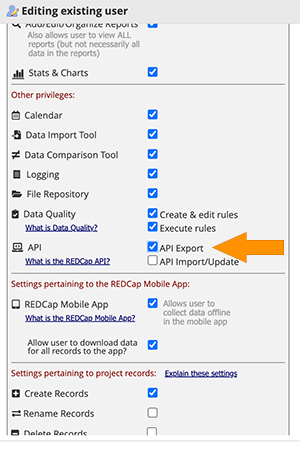
The User Rights panel will open in the main part of your screen. Click on your user id (or your role) and choose Edit User Privileges. Give yourself API Export access, as shown in the image below. For now, we’ll leave API Import/Update turned off, so that you feel secure knowing you can’t accidentally upload anything that could mess up your data.
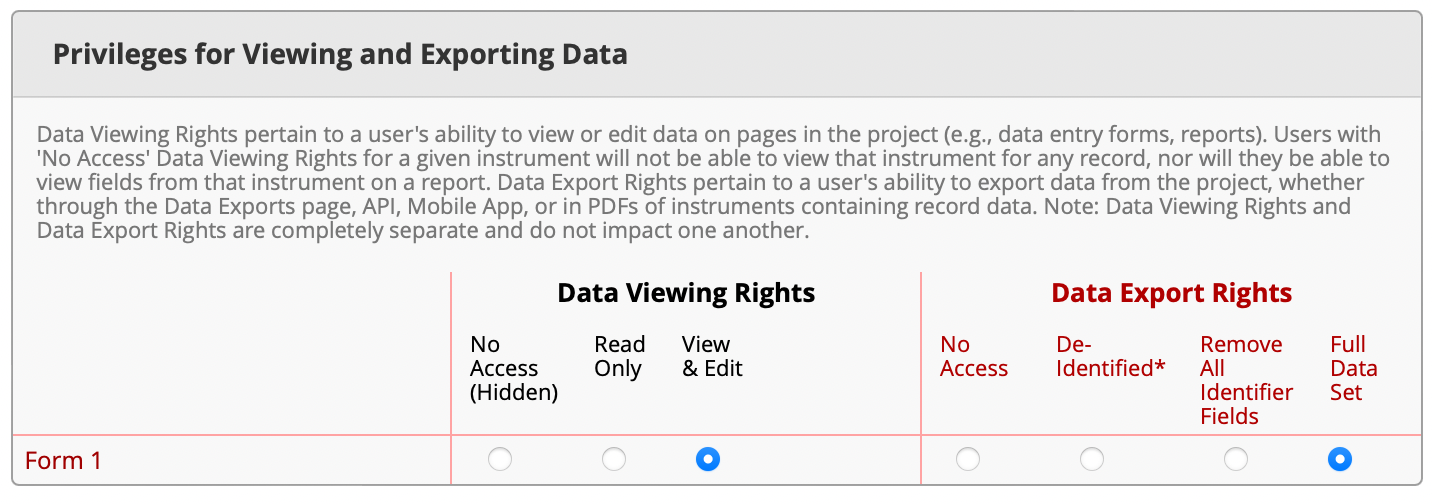
Next, look for a box on the right side of your User Rights panel labeled Privileges for Viewing and Exporting Data. If you see it, give yourself some Data Export Rights (note that older versions of REDCap may not show this option). We recommend Full Data Set, but you can choose a less privileged level of access if you’re working with identified data and want to be extra careful. Note that our sample project on cervical cancer risk factors is already de-identified.
This is what we’re talking about:
Once you’re all done giving yourself API export rights and (if applicable) data export rights, click Save Changes.
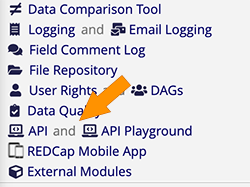
Refresh your browser (reload the page) so that your new permissions are included in what you get shown in your project. Now, on the left hand side of the project, you should see something new under Applications – API and API Playground.
Generating an API Token
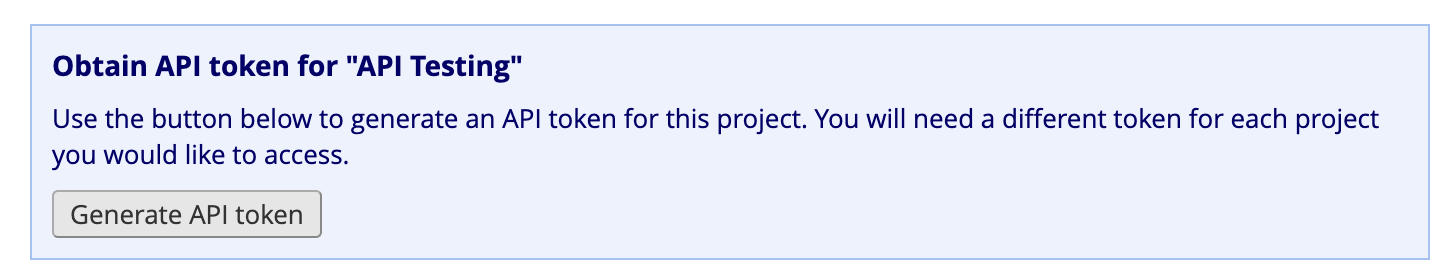
So now you have the right to use the API, but you can’t start using it just yet. You have to generate an API token. Click on the API application in the left side menu and in the main part of your screen, click on the button to Generate API Token. At CHOP, the token will be generated immediately; at other institutions, the token might be generated immediately, or it might have to be generated manually by an administrator a few minutes or hours later.
The API token is unique to the combination of user and project. It’s a code that allows access only to the data in a single project and only the data that the person who generated the API token is allowed to see. If you have three different projects, your token is different for each one. Importantly, if you feel like you may have accidentally given your API token away, it’s a good idea to regenerate it, which is a single-click operation. It makes your old token invalid and creates a new token.
Soon, your API token will show up in that same API Application. It will look something like this (note, I’ve obscured my token – sharing this in a post like this one would be a terrible idea!).
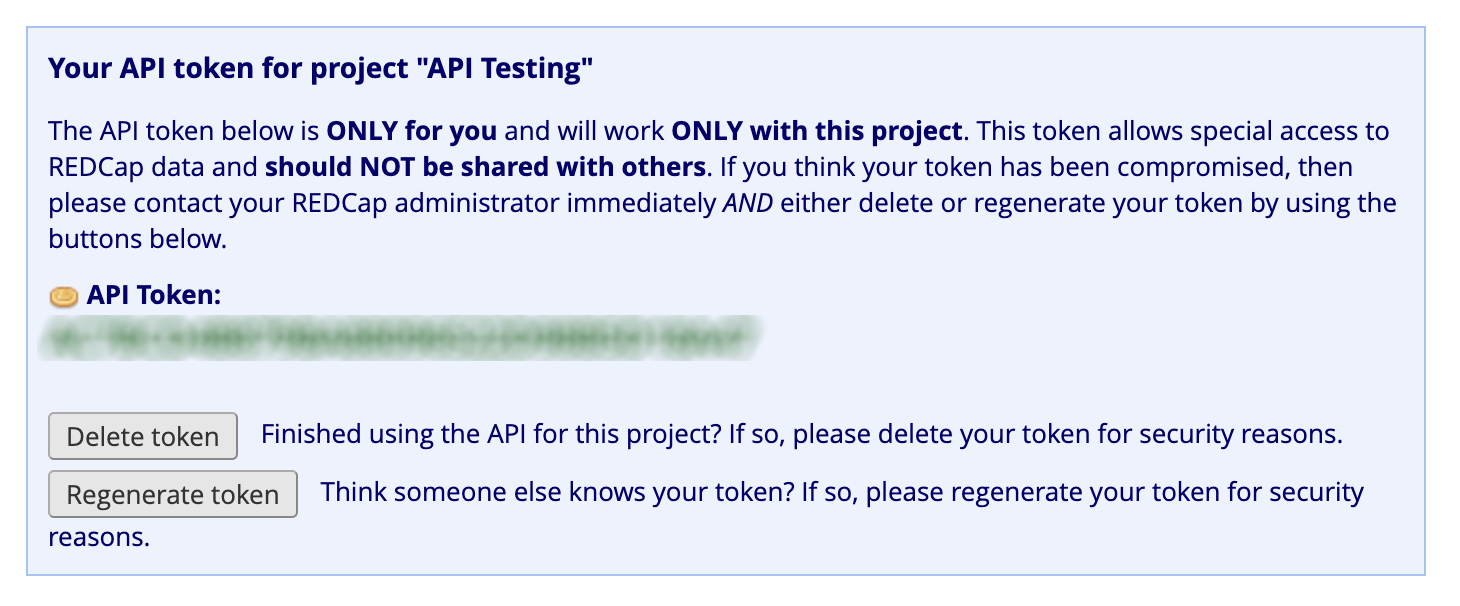
You’ll use this token when you request data in your R or Python script.
Rehearsing your API Calls in the API Playground
So, you have some data in a REDCap database, and you have an API key that gives you access to that data. How do you use this key, though? Learning how to use an API can be tricky, because it requires you to pass not only the key, but your actual request (like “give me only the field species or “give me only the form called inclusion_criteria”). Luckily, REDCap provides you an “API Playground” that gives you not only a view into what the API can do, but provides a good start to giving you the actual code. Let’s take a deeper look.
The API Playground has several parts:
- The menu-driven selection box
- Raw Request Parameters
- Response
- Code Examples
Let’s look at how each part of the API Playground helps you learn the API.
API Method
In your REDCap project, head over to the API Playground – click on that phrase in the Applications pane on the left. Then, at the top of your screen, you’ll see the menu-driven selection box. The first selection you have to make is API Method.
Choose Export Records as the API method. This will allow you to download records (rows of data). Make sure that:
- The “Format” (second option down) is “CSV” and
- The “Type” (third option down) is “flat.”
You don’t have to change any other fields. Leaving everything else alone means you’ll download all the records (rows) and all of the forms / instruments with all of their fields (columns) into a single .csv, or comma separated values, file. Be careful not to choose .json as the format!
The Raw Request Parameters box below your selection will change to reflect whatever you chose. Here’s an example of what you might see, if you’re using the cervical cancer data. If you’re using your own dataset, things will look different. Note that we’ve blurred out the API key here – that’s not something we want to share!
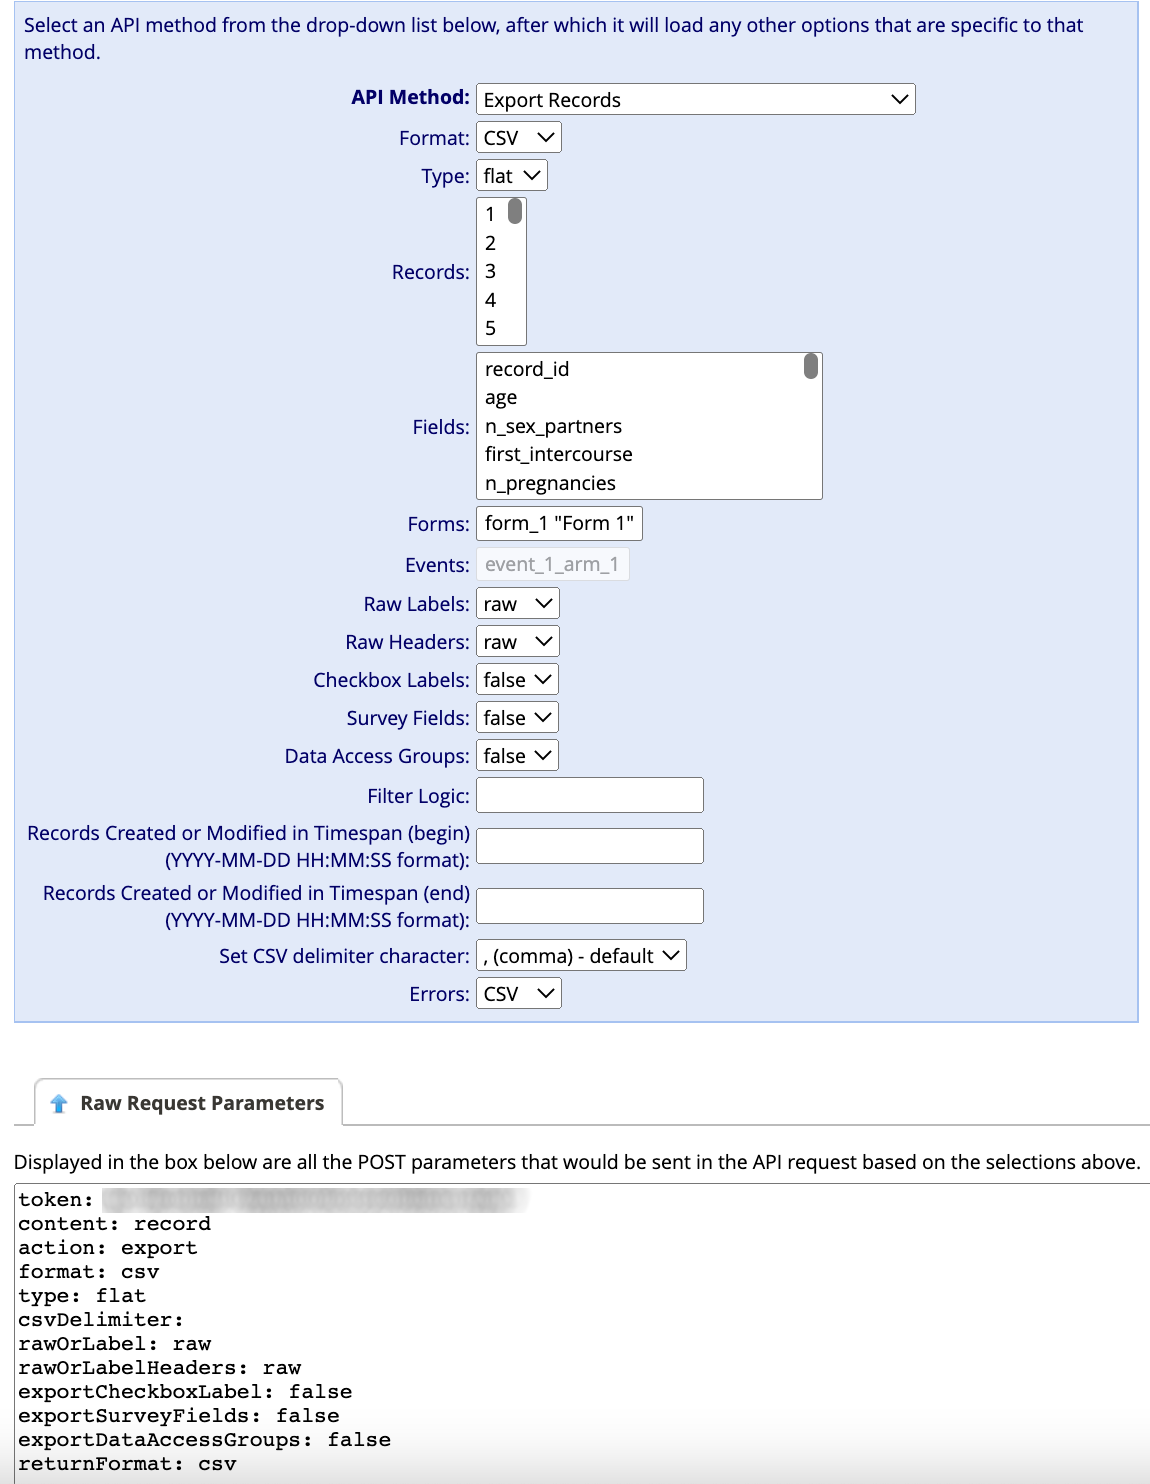
This Raw Request Parameters gives you a quick look at the information you’re passing to REDCap, to make sure you selected what you really wanted in the menu part above.
Execute Request
Look further down the API Playground page, in the “Response” area, and click on the button that says “Execute Request”. You might get a “waiting” spinner, and then a box will appear below the button with the data that REDCap returned from your request.
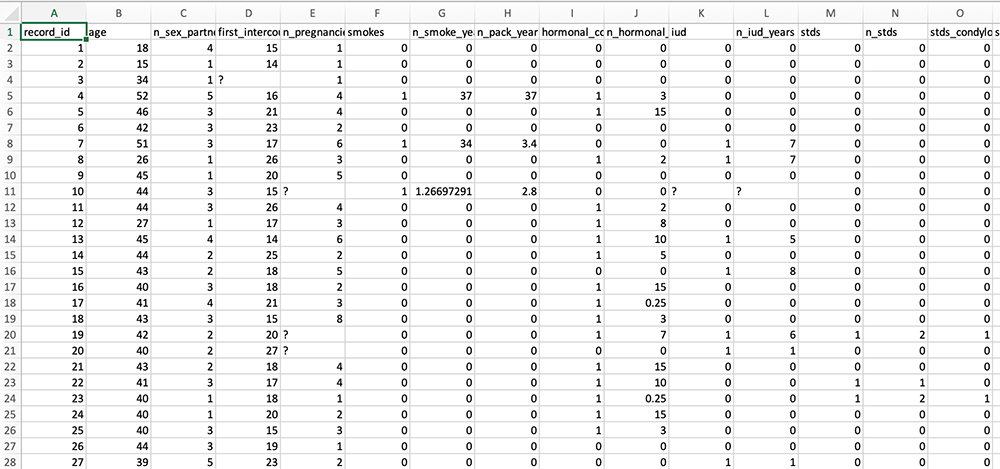
You requested your data to be in a .csv, so you should get some data that’s “comma separated” – a bunch of fields that are separated by commas, with each new line of data being separated by a line break. In the “Response” box, all of this is presented in plain text, not in a table, so it might look confusing or overwhelming. If you want to, you can copy that plain text and paste it into a text editor, saving it with the .csv extension. That will allow you to then open it in Excel to see if the .csv is what you intended. Below, here’s the cervical cancer data “before”, as comma separated values in plain text, and “after”, as text saved as a .csv and opened in Excel:
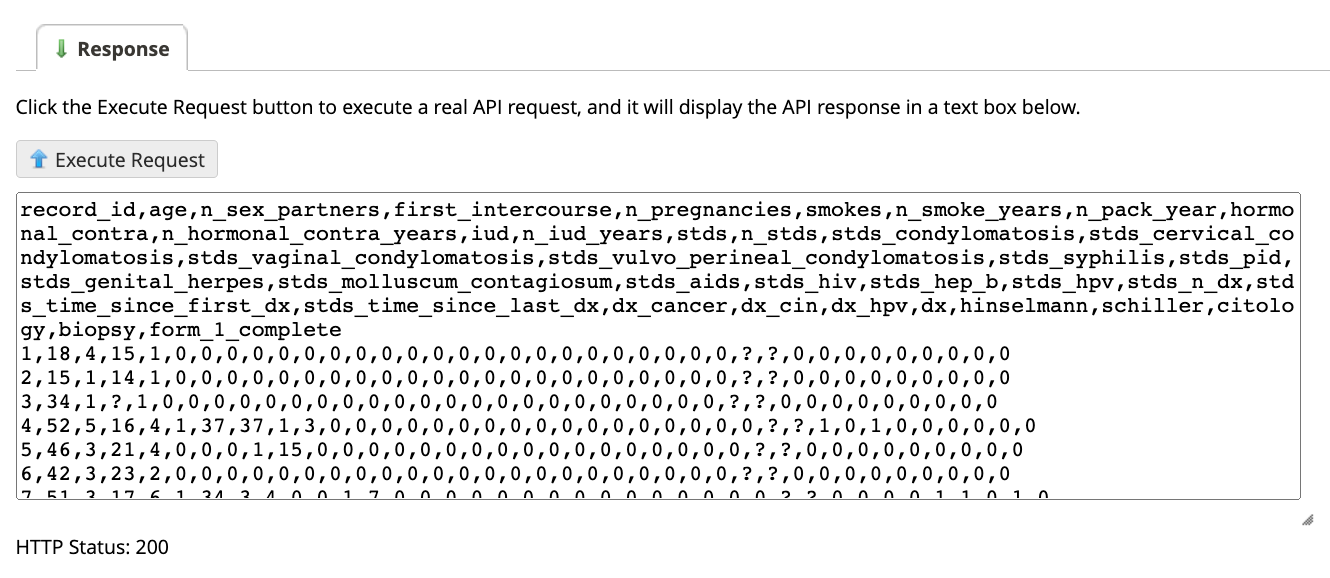
Below that box, you’ll see an HTTP status. You want that to be 200, which means no errors occurred (if an error did occur, you may need to take another look at your rights in the User Rights section of REDCap).
This is an example of trying out and learning about the API without having to write code. You can experiment with various methods and learn easily without having to go through the frustration of writing a lot of code to find out how to do things.
In some API methods, like “Export Records”, you’ll have a number of drop down menus you can choose from to tailor your request, including which “forms” and which “fields” you want to retrieve. You can make multiple choices in menus like these by holding down control while clicking (Windows) or command while clicking (Mac). Helpfully, however, if you want every item listed (say, you want every form and every field), you don’t click any selection at all, and REDCap assumes you mean everything that appears in the drop-down list.
Writing Code to Access Data
So, you’ve played around in the API Playground and you think you know the kind of API call you want to make. Now, how do you automate this selection so that your R or Python code will issue exactly the same request using code like you just did using menus? REDCap’s API playground comes to the rescue again, with code snippets that show how to write the code to do automatically what you just did manually.
In the tabs at the bottom of the API Playground, you’ll see names of programming languages, including Python and R. Below you can see what the Python code looks like for the API request to retrieve all records from the cervical cancer database:
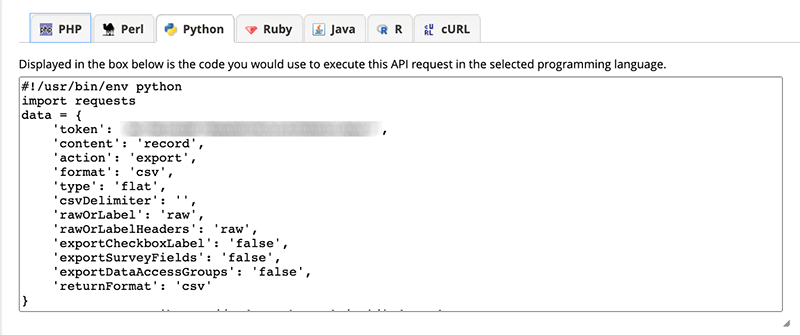
With these code snippets, we’re most of the way there to data access. There’s a little bit of tweaking that we need to do, but not much!
Let’s try that code in actual Python and R scripts!
Python
Open a Jupyter notebook (running Python 3) and paste the code from the API Playground’s “Python” tab into your first cell and run that cell. It works! Kind of. Take a look below to see what the result of our API call for the records of cervical cancer data looks like.
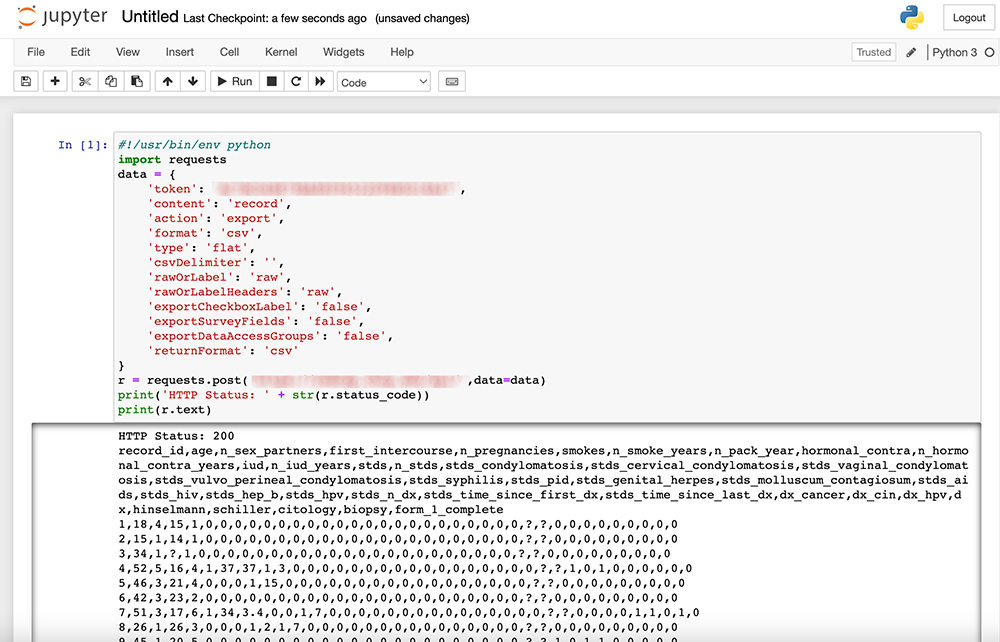
What’s the only problem with this? Well, it’s not in a pandas data frame, which is what we’d prefer to work with. We can fix that by adding a few lines of code! Add this to a second cell, and run it.
import pandas as pd
from io import StringIO
df = pd.read_csv(StringIO(r.text))
df
Below, this is the result when we do that for our cervical cancer data database:
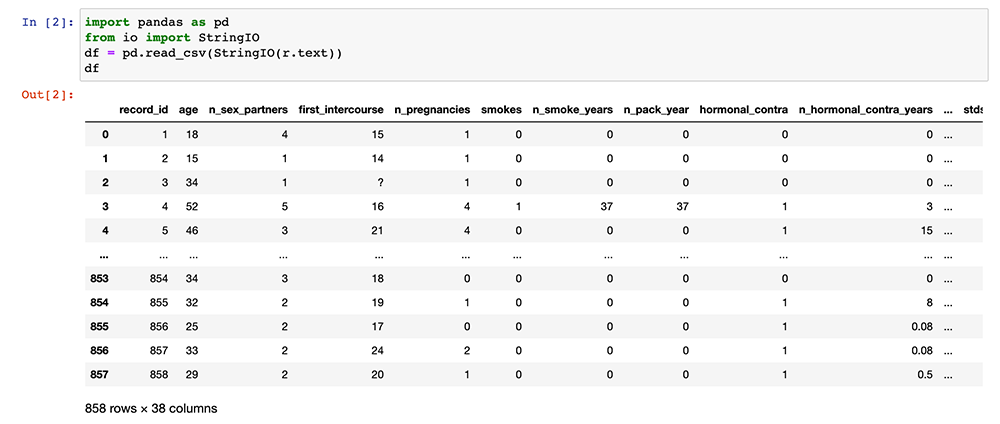
Now, your data is in a pandas data frame and you’re ready to do all sorts of work with that data (like cleaning question marks out of the data, getting summary statistics, finding correlations, visualizing data, and modeling data). Importantly, you can re-run the cells in this notebook at any time to get the latest version of the data from REDCap!
As a note, there is a useful Python library called PyCap that simplifies data import from REDCap into Python. However, we think it’s important to show you how to use the code REDCap provides because it is reliable and reflects the current state of the REDCap API. Furthermore, although this library is great and seems very stable, Python libraries depend on volunteers who keep them updated. Therefore, we think it’s useful to know how to use the basic method we’ll share here, even if in the future you prefer a different approach.
R
REDCap assumes you’re going to use an R script and not an R Markdown document, but we advocate using R Markdown for just about everything you do in R, so we’re going to teach that approach.
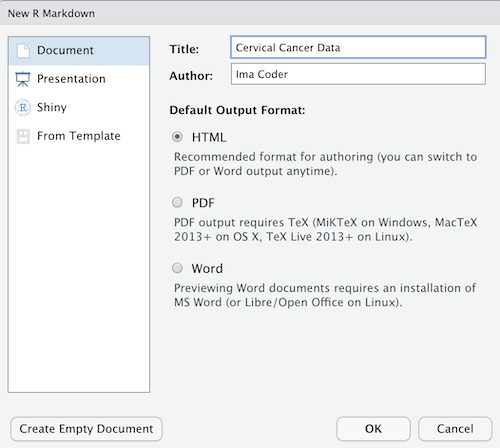
First, open RStudio and create a new R Markdown (File > New File > R Markdown). Give your R Markdown the title and author information you want, leave the default output choice (HTML), and click on OK.
Remove all the “boilerplate” text after the setup chunk (so, delete all the lines after around line 10) and add a new empty chunk:
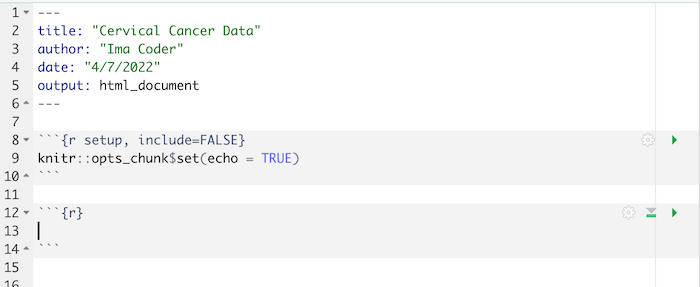
Then:
- Copy the R code from the API Playground and paste it into the empty chunk
- Remove the first line (the one that starts
#!/usr/bin). - Run that chunk!
After running that chunk, you should have some new objects in your Environment. Of particular interest is the object called result. See below what we see when we run the chunk of code to get records from the cervical cancer database:
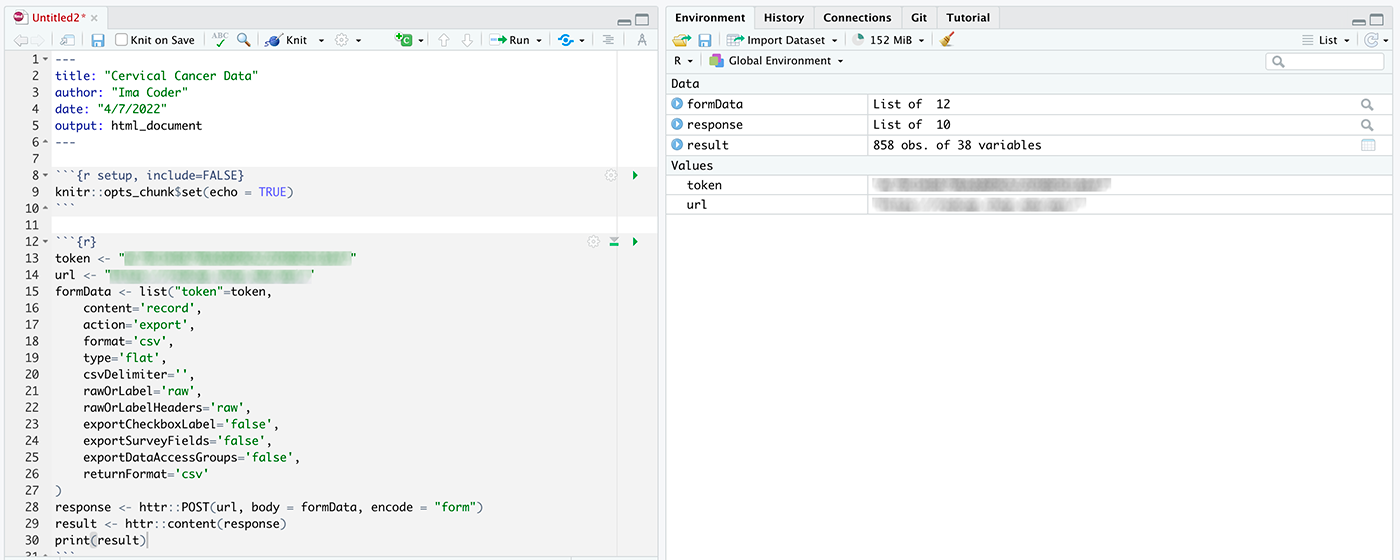
Click on “result” in the environment pane to open a file viewer.
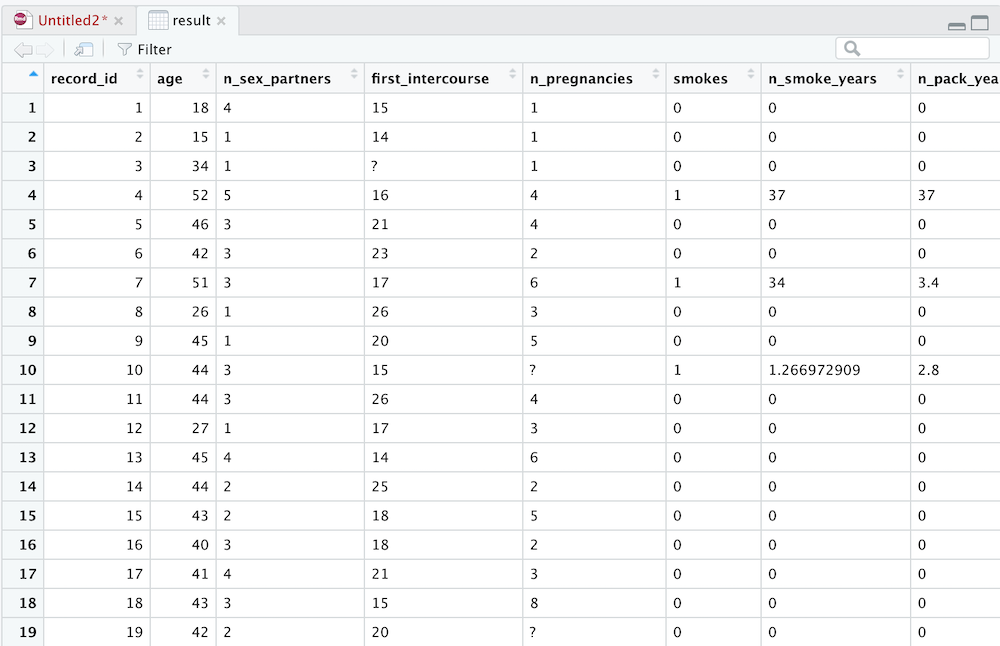
Now, your data is in a data frame and you’re ready to do all sorts of work with that data (like cleaning question marks out of the data, getting summary statistics, finding correlations, visualizing data, and modeling data). Importantly, you can re-run the chunks in this R Markdown at any time to get the latest version of the data from REDCap!
As with Python, there are useful R packages that make importing REDCap data into R simpler than the code REDCap suggests. Nevertheless, we think it’s useful to know how to use the basic method we’ll share here, even if in the future you prefer a different approach. The R packages that streamline the process (we like REDCapR and redcapAPI) are very stable, but, like Python libraries, R packages also depend on volunteers who keep them updated.
Now you know how to reach in directly to REDCap to get data in or about your project and bring it into R or Python!