Jupyter 101
Let’s do a quick intro to doing data visualization in a Jupyter Notebook (you may also hear this called “iPython Notebook”).
First, if you don’t already have a Python environment set up, consider using Anaconda, which is a distribution includes Jupyter. If you prefer to use a different Python setup, install Jupyter in your favorite way (probably pip).
All set up? Great! Go to your command line, navigate to the directory you want your notebook file to live in, and just type in jupyter notebook:
> jupyter notebook
You’ll see some feedback from the notebook, telling you where your notebook server is listening, and you should have a browser window pop up:
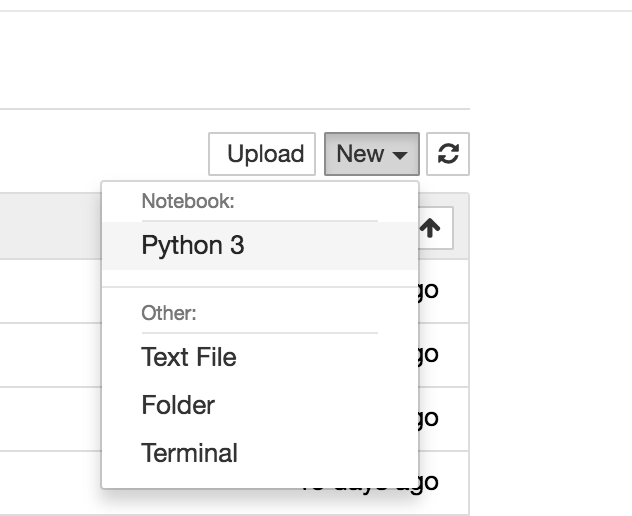
In the upper right, you can choose “New”, and select Python notebook (in this code example I’m using Python 3).
Now you have a REPL (pronounced “repple”): a Read, Evaluate, Print Loop. It’s a way to work with Python in tiny bits, with incremental success (or failure) that you can see immediately and alter and play with, instead of writing and executing an entire script. The first thing you’ll want to do is import some packages. For fun, type “import antigravity” in the first box. See how the text changes color to help you with the syntax?
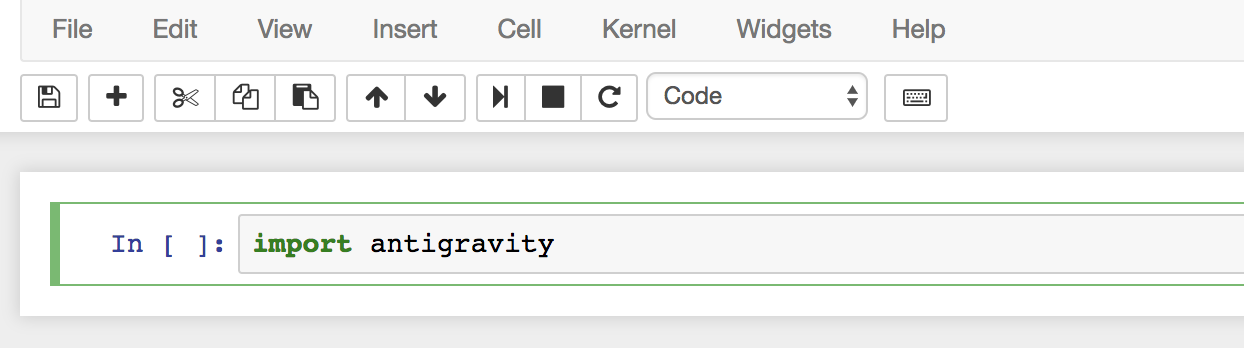
See how the leftmost vertical side of the box is green? That means this code block is selected and being edited. If it were blue, it would mean the code block was selected, but not being edited. No box at all? That means the block is not selected.
Since the block is selected, we can hit the “play” button in the top bar:
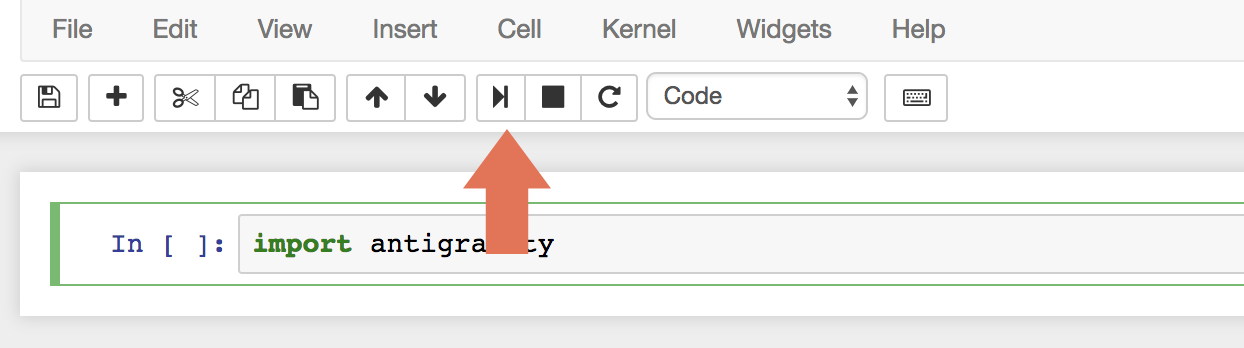
What happened? Hopefully a new browser window opened with some fun content! You can close that and go back to the tab in your browser that has your notebook. You will have a new box below your original one, which was created when you hit the execute (“play”) button. You can also add a new block using the “plus” button. Click on the “import antigravity” block, and select “Edit”, then “Delete Cells” to remove it.
Let’s create a few blocks together.
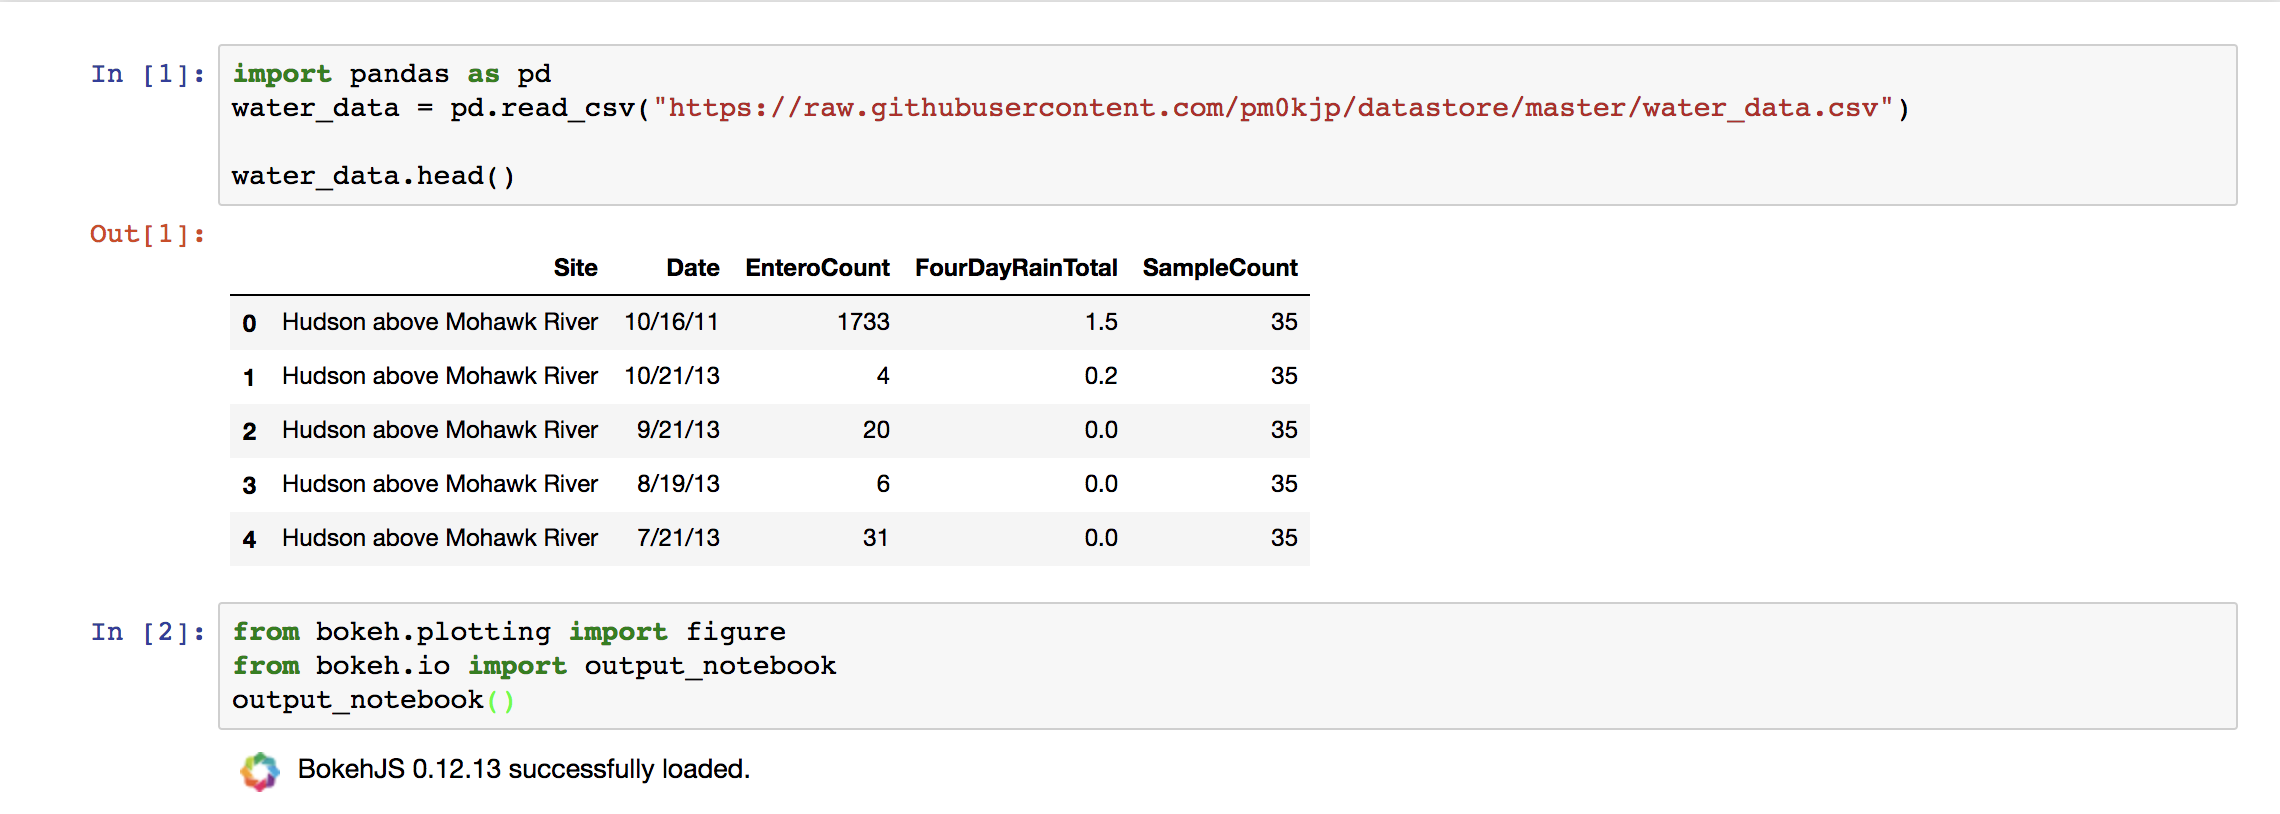
In one block, type the following, which will pull some data about water quality from GitHub. Then hit the play button.
If at any time you get an error like ModuleNotFoundError: No module named ..., that means that you have to install the module (for example, pandas or bokeh). You can do that using conda install or pip install on the command line.
import pandas as pd
water_data = pd.read_csv("https://raw.githubusercontent.com/pm0kjp/datastore/master/water_data.csv")

water_data.head()
Then, in a new block, add the following, and hit the play button once you’re done. Don’t forget, if you need a new block you can always hit the plus sign.
from bokeh.plotting import figure, show
from bokeh.io import output_notebook
output_notebook()
Hopefully you see something like this:
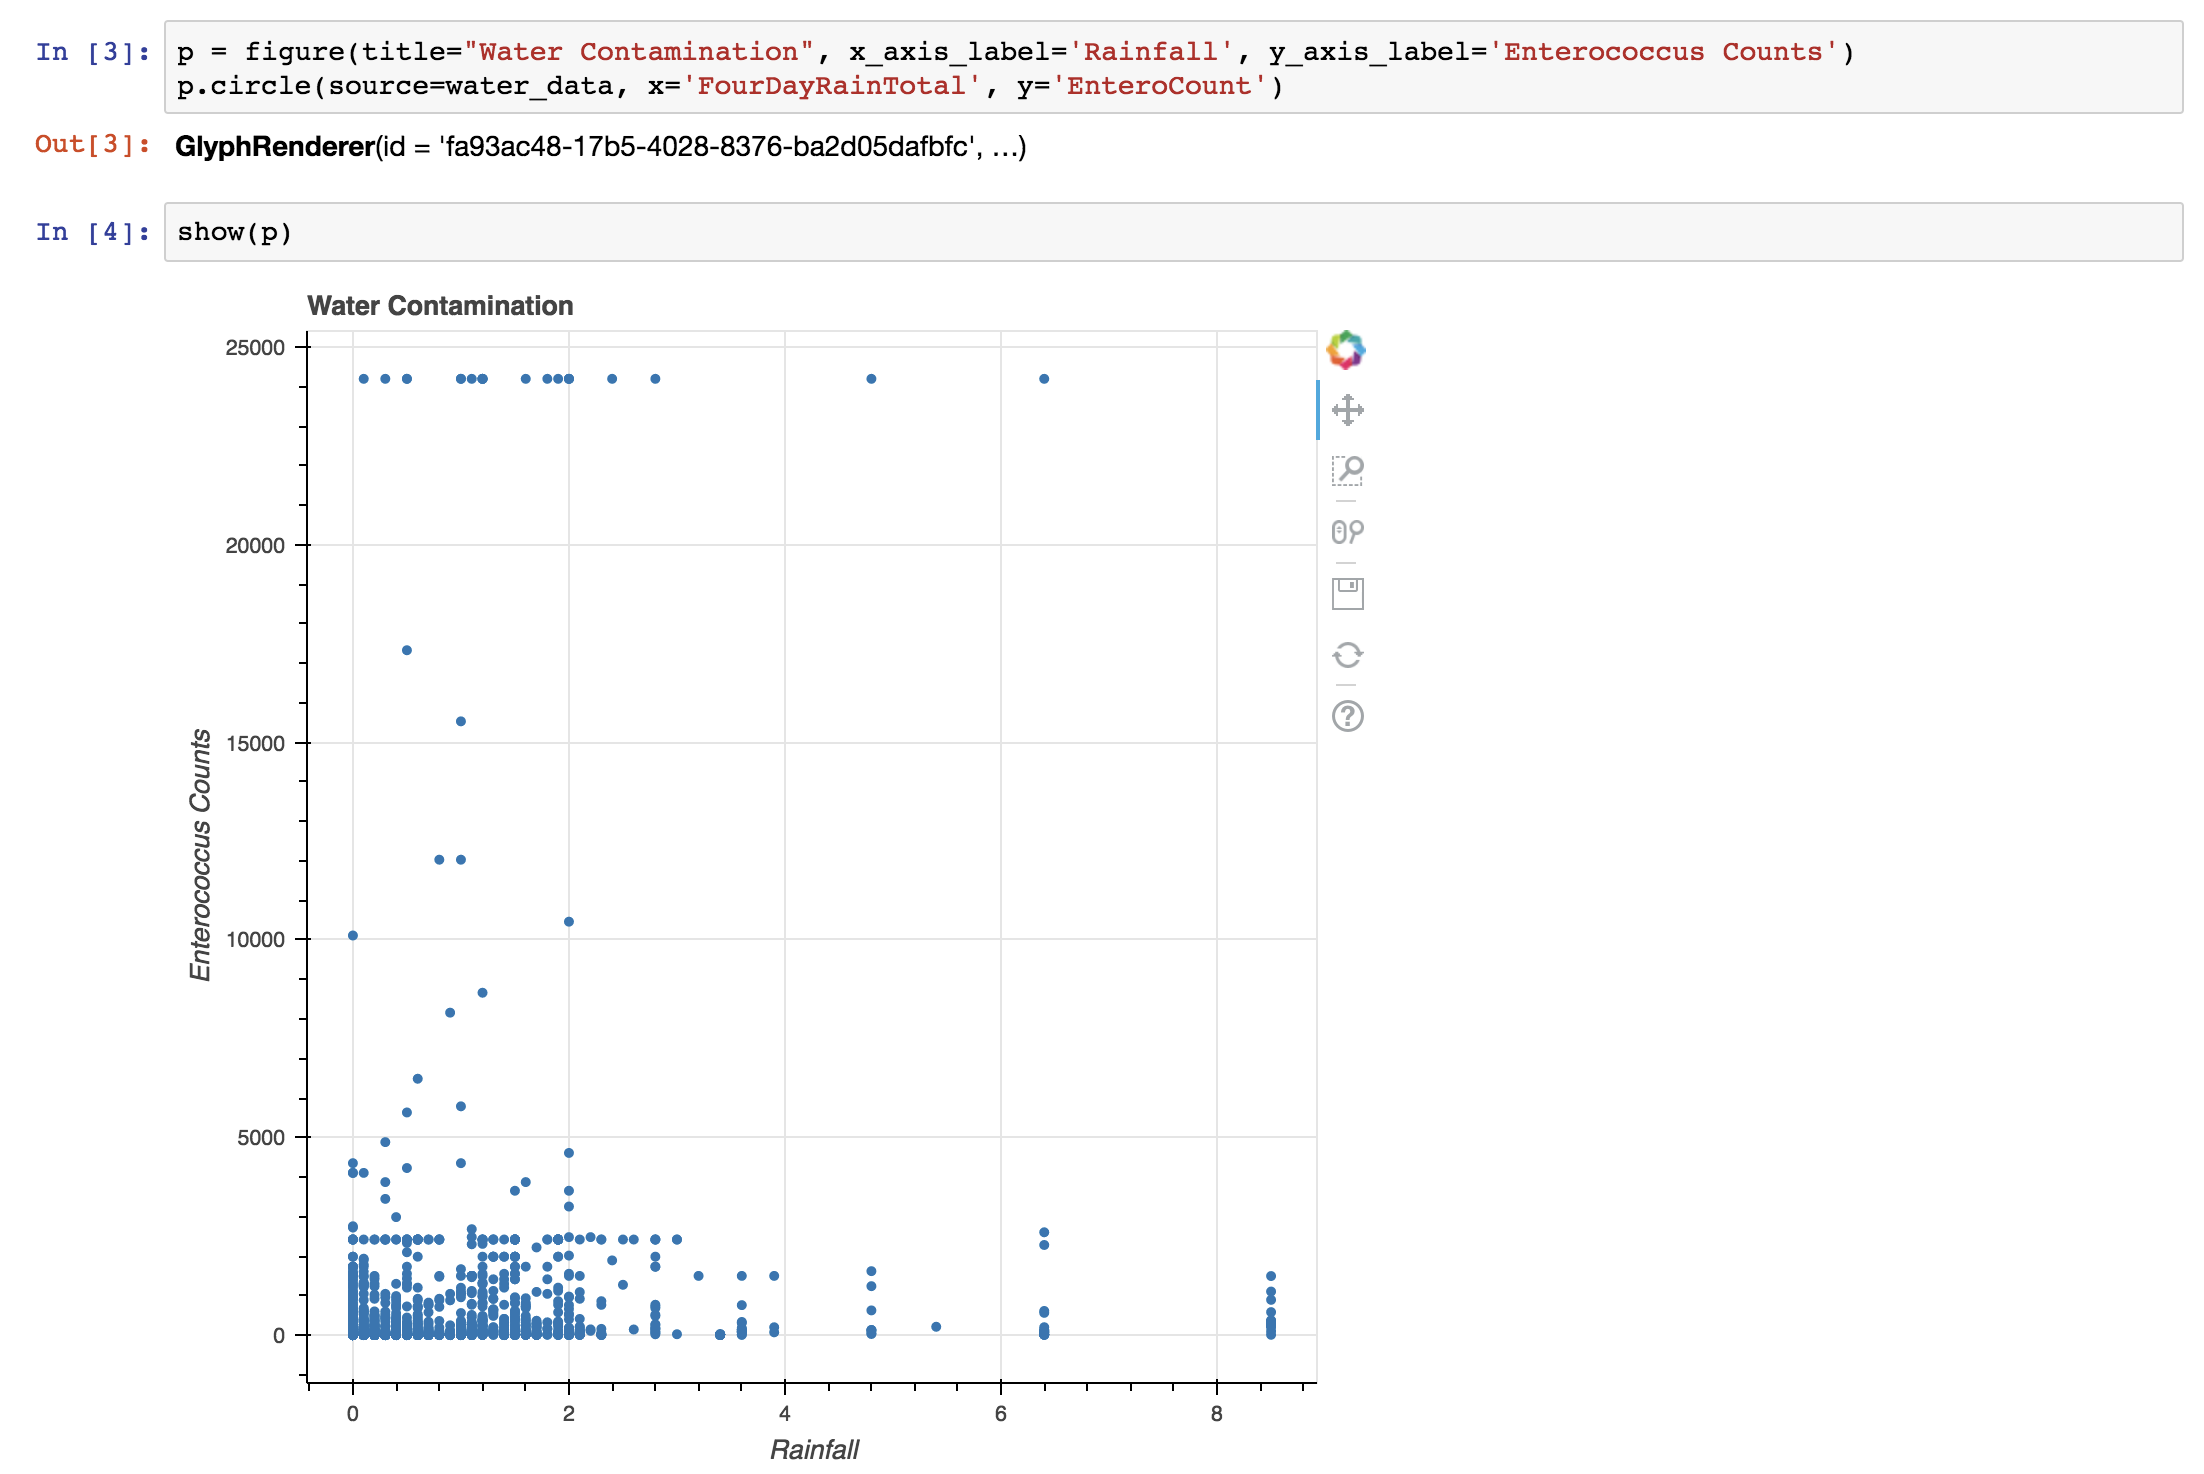
We can create a visualization in Bokeh in our third block, and display it in a fourth:
For block 3, add and run:
p = figure(title="Water Contamination", x_axis_label='Rainfall', y_axis_label='Enterococcus Counts')
p.circle(source=water_data, x='FourDayRainTotal', y='EnteroCount')
In block 4:
show(p)
You should see a something like this: