
Data Combining in R
“Munging” (rhymes with “lunging”) is the data professional’s slang for cleaning and reshaping data. Data munging is a broad subject, but here we’re talking about combining data.
Data combination can take several forms:
-
Merging – when you have some identifier(s) like MRN or subject ID that are common to multiple datasets, like “patient_insurance_info”, “patient_vitals”, and “patient_meds”.
-
Column binding – when you have new data that already lines up row-to-row and you need to just slide those new columns into place beside existing columns.
-
Row binding – when you have new data that already lines up column-to-column and you need to append data to the bottom of an existing dataset.
Let’s take each one in turn. You can follow along below, or download the complete code.
Merging
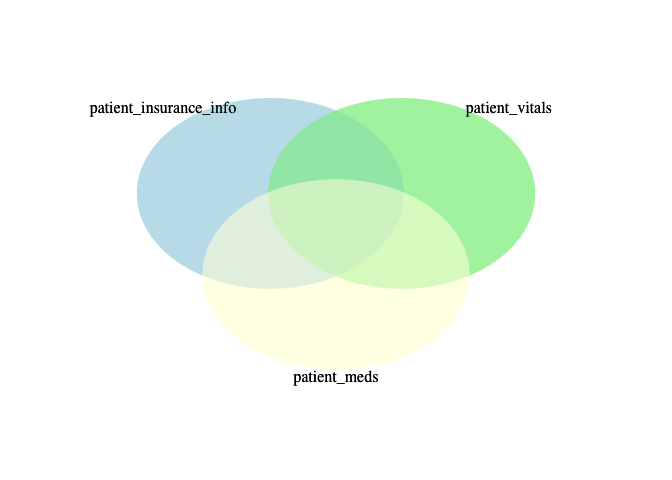
Merging data is like a Venn Diagram. Let’s take the example of our patient data. We have information about various patients in three tables (data frames in R):
- patient_insurance_info
- patient_vitals
- patient_meds
You can have various levels of overlaps – some patients will exist in only one of these, others in two, others in all three. You can choose which overlap you want. Maybe it looks something like this?
Let’s practice. First, I’ll generate some fake data fields. Don’t worry about this code, unless you want to learn how to generate fake data quickly!
mrns <- seq(11000, 99000, by=1787)  # gives us 50 fake MRNS
bp_systolic <- seq(80,190, by=5) # gives us fake systolic bps
bp_diastolic_diff <- seq(-50, -10, by = 2) # gives us how much less diastolic will be
temp <- seq(97,101, by = 0.1) # gives us fake temps
insurance <- c("uninsured", "Aetna", "Medicaid", "IBX", "Cigna") # gives us fake insurance
meds <- c("albuterol", "buspirone", "oxycodone", "atomoxetine", "amoxicillin", "ibuprofen", "acetaminophen", "cetirizine",
          "lansoprazole", "paroxetine", "methylphenidate", "glipizide") # gives us fake meds
And now some fake datasets. We have 50 MRNS, so I’ll put 40 of each in the three data frames. That ensures a bit of overlap. Again, this is not something you have to understand 100%, I’m just generating some data frames that contain fabricated data.
set.seed(42)
patient_insurance_info <- data.frame(mrn=sample(mrns, 40, replace=FALSE),
                                     insurance=sample(insurance,40, replace=TRUE))
patient_vitals <- data.frame(mrn=sample(mrns, 40, replace=FALSE),
                             systolic = sample(bp_systolic,40, replace=TRUE),
                             diastolic = NA_integer_,
                             temp = sample(temp, 40, replace=TRUE))
patient_vitals$diastolic <- patient_vitals$systolic + sample(bp_diastolic_diff, 40, replace = TRUE)
patient_meds <- data.frame(mrn=sample(mrns, 40, replace=FALSE),
                           meds = replicate(40, paste0(sample(meds, sample(0:7,1), replace=FALSE), collapse = ", ")))
Let’s peek:
head(patient_insurance_info)## mrn insurance
## 1 91415 Aetna
## 2 98563 Medicaid
## 3 34231 uninsured
## 4 80693 Cigna
## 5 62823 Medicaid
## 6 52101 Cigna
head(patient_vitals)## mrn systolic diastolic temp
## 1 62823 120 106 100.8
## 2 23509 125 95 99.2
## 3 41379 145 129 99.4
## 4 64610 145 113 97.8
## 5 73545 160 116 99.1
## 6 55675 125 93 97.7
head(patient_meds)## mrn meds
## 1 16361 albuterol, oxycodone, paroxetine
## 2 59249 oxycodone, ibuprofen
## 3 98563
## 4 27083 albuterol, paroxetine
## 5 55675 atomoxetine, amoxicillin, glipizide, albuterol, acetaminophen
## 6 48527 buspirone, albuterol, amoxicillin, paroxetine
Doing the merge
To merge data, you need one or more columns that act as the “pivot” or “match” to line up the rest of the data. In our case, we just have one identifying column, the MRN. In other use cases, you might want to line up data on both the MRN and the encounter ID, or something like that.
You also need to know what overlap of data you want. Do you want only the patients that have data in all three tables? Or all patients who have any data at all? Or patients that have both vitals and meds, but insurance is optional?
We merge one table in at a time, so you can choose the overlap each time. Let’s start by merging so that we end up only with the patients that have all three kinds of data. That’s the default behavior of merge, so we don’t have to add any extra fields to indicate that.
merged_1 <- merge(patient_insurance_info, patient_meds)
merged_1 <- merge(merged_1, patient_vitals)
How many rows does merged_1 have? What does it look like?
nrow(merged_1)## [1] 26
head(merged_1)## mrn insurance
## 1 11000 uninsured
## 2 16361 uninsured
## 3 18148 Cigna
## 4 21722 Aetna
## 5 27083 IBX
## 6 28870 Medicaid
## meds
## 1 buspirone, lansoprazole, atomoxetine
## 2 albuterol, oxycodone, paroxetine
## 3 albuterol, glipizide, ibuprofen, paroxetine
## 4 methylphenidate, glipizide
## 5 albuterol, paroxetine
## 6 lansoprazole, glipizide, paroxetine, albuterol, buspirone, oxycodone
## systolic diastolic temp
## 1 145 121 98.6
## 2 190 160 98.2
## 3 80 66 97.4
## 4 85 41 100.5
## 5 155 121 99.9
## 6 185 175 98.8
What if we wanted everyone, regardless of any missing data? I can set all=TRUE to say “hang on to all data, even if there’s no overlap”.
merged_2 <- merge(patient_insurance_info, patient_meds, all = TRUE)
merged_2 <- merge(merged_2, patient_vitals, all=TRUE)
How many rows does merged_2 have? What does it look like?
nrow(merged_2)## [1] 49
head(merged_2)## mrn insurance meds systolic
## 1 11000 uninsured buspirone, lansoprazole, atomoxetine 145
## 2 14574 Cigna NA
## 3 16361 uninsured albuterol, oxycodone, paroxetine 190
## 4 18148 Cigna albuterol, glipizide, ibuprofen, paroxetine 80
## 5 19935 IBX glipizide, lansoprazole, ibuprofen NA
## 6 21722 Aetna methylphenidate, glipizide 85
## diastolic temp
## 1 121 98.6
## 2 NA NA
## 3 160 98.2
## 4 66 97.4
## 5 NA NA
## 6 41 100.5
The “NA” here indicates missing data!
Finally, what if we want to say that patients have to have meds, but not vitals or insurance, to be included? Here we’ll set one dataset to be “x”, another to be “y”, and we can say that all.x=TRUE (keep all the x’s, but only keep y’s that also exist in x), or all.y=TRUE (similar idea).
merged_3 <- merge(x=patient_insurance_info, y=patient_meds, all.y = TRUE)
merged_3 <- merge(merged_3, patient_vitals, all=TRUE)
How many rows does merged_3 have? What does it look like?
nrow(merged_3)## [1] 48
head(merged_3)## mrn insurance meds systolic
## 1 11000 uninsured buspirone, lansoprazole, atomoxetine 145
## 2 14574 Cigna NA
## 3 16361 uninsured albuterol, oxycodone, paroxetine 190
## 4 18148 Cigna albuterol, glipizide, ibuprofen, paroxetine 80
## 5 19935 IBX glipizide, lansoprazole, ibuprofen NA
## 6 21722 Aetna methylphenidate, glipizide 85
## diastolic temp
## 1 121 98.6
## 2 NA NA
## 3 160 98.2
## 4 66 97.4
## 5 NA NA
## 6 41 100.5
Column binding
Let’s take one of our combined datasets, say merged_1 (26 patients), and column bind another set of columns to it. Let’s say we have a dataframe that includes a randomly assigned group, for a clinical trial, as well as some tracking numbers that will be assigned to each patient and included in barcodes on drug and biosamples. We don’t have to line this up with any field in the merged_1 dataset.
set.seed(42)
randomization <- data.frame(group = sample(c("Group 1", "Group 2", "Group 3"), 26, replace = TRUE),
                            drug_tracking_number = sample(c(2453:5213), 26, replace = FALSE),
                            biosample_tracking_number = sample(c(34523412:52341297), 26, replace = FALSE))
head(randomization)
## group drug_tracking_number biosample_tracking_number
## 1 Group 3 3530 41623579
## 2 Group 3 4952 48504978
## 3 Group 1 3686 35217177
## 4 Group 3 4758 47865362
## 5 Group 2 4486 46591053
## 6 Group 2 4688 37574980
We can just line these up, side by side, like this:
[A] [B] -> [AB]
col_bound <- cbind(merged_1, randomization)
head(col_bound)
## mrn insurance
## 1 11000 uninsured
## 2 16361 uninsured
## 3 18148 Cigna
## 4 21722 Aetna
## 5 27083 IBX
## 6 28870 Medicaid
## meds
## 1 buspirone, lansoprazole, atomoxetine
## 2 albuterol, oxycodone, paroxetine
## 3 albuterol, glipizide, ibuprofen, paroxetine
## 4 methylphenidate, glipizide
## 5 albuterol, paroxetine
## 6 lansoprazole, glipizide, paroxetine, albuterol, buspirone, oxycodone
## systolic diastolic temp group drug_tracking_number
## 1 145 121 98.6 Group 3 3530
## 2 190 160 98.2 Group 3 4952
## 3 80 66 97.4 Group 1 3686
## 4 85 41 100.5 Group 3 4758
## 5 155 121 99.9 Group 2 4486
## 6 185 175 98.8 Group 2 4688
## biosample_tracking_number
## 1 41623579
## 2 48504978
## 3 35217177
## 4 47865362
## 5 46591053
## 6 37574980
Row binding
What if we’re combining data, say, from different groups or contributors (like a multi-site study)? It’s easy to just “stack” data!
Let’s take our patient_vitals data frame and row bind it with a vitals_by_pt data frame taken from somewhere else (maybe another researcher at another hospital?). Note that the column names have to match!
vitals_by_pt <- data.frame(mrn = sample(c(200000:3000000),25, replace=FALSE),
                           systolic = sample(bp_systolic, 25, replace=TRUE),
                           diastolic = NA_integer_,
                           temp = sample(temp, 25, replace=TRUE))
vitals_by_pt$diastolic <- vitals_by_pt$systolic + sample(bp_diastolic_diff, 25, replace = TRUE)
all_vitals <- rbind(patient_vitals, vitals_by_pt)
How many rows does all_vitals have? What does it look like?
nrow(all_vitals)## [1] 65
head(all_vitals)## mrn systolic diastolic temp
## 1 62823 120 106 100.8
## 2 23509 125 95 99.2
## 3 41379 145 129 99.4
## 4 64610 145 113 97.8
## 5 73545 160 116 99.1
## 6 55675 125 93 97.7
tail(all_vitals)## mrn systolic diastolic temp
## 60 1642168 145 111 100.8
## 61 2283114 145 115 98.2
## 62 1933633 160 126 97.6
## 63 1953473 125 79 99.9
## 64 808036 185 169 98.3
## 65 806383 190 164 100.1
Next steps
When you’re combining data, you’re unlikely to have such clean-cut examples of exact column name matches. Data is notoriously messy and you might need to do additional cleaning and preparation prior to combining data and afterwards. This kind of work, too, falls under the “munging” umbrella, and we’ll continue working on that in future posts!